
Your 2026 Guide to Developer Console Salesforce
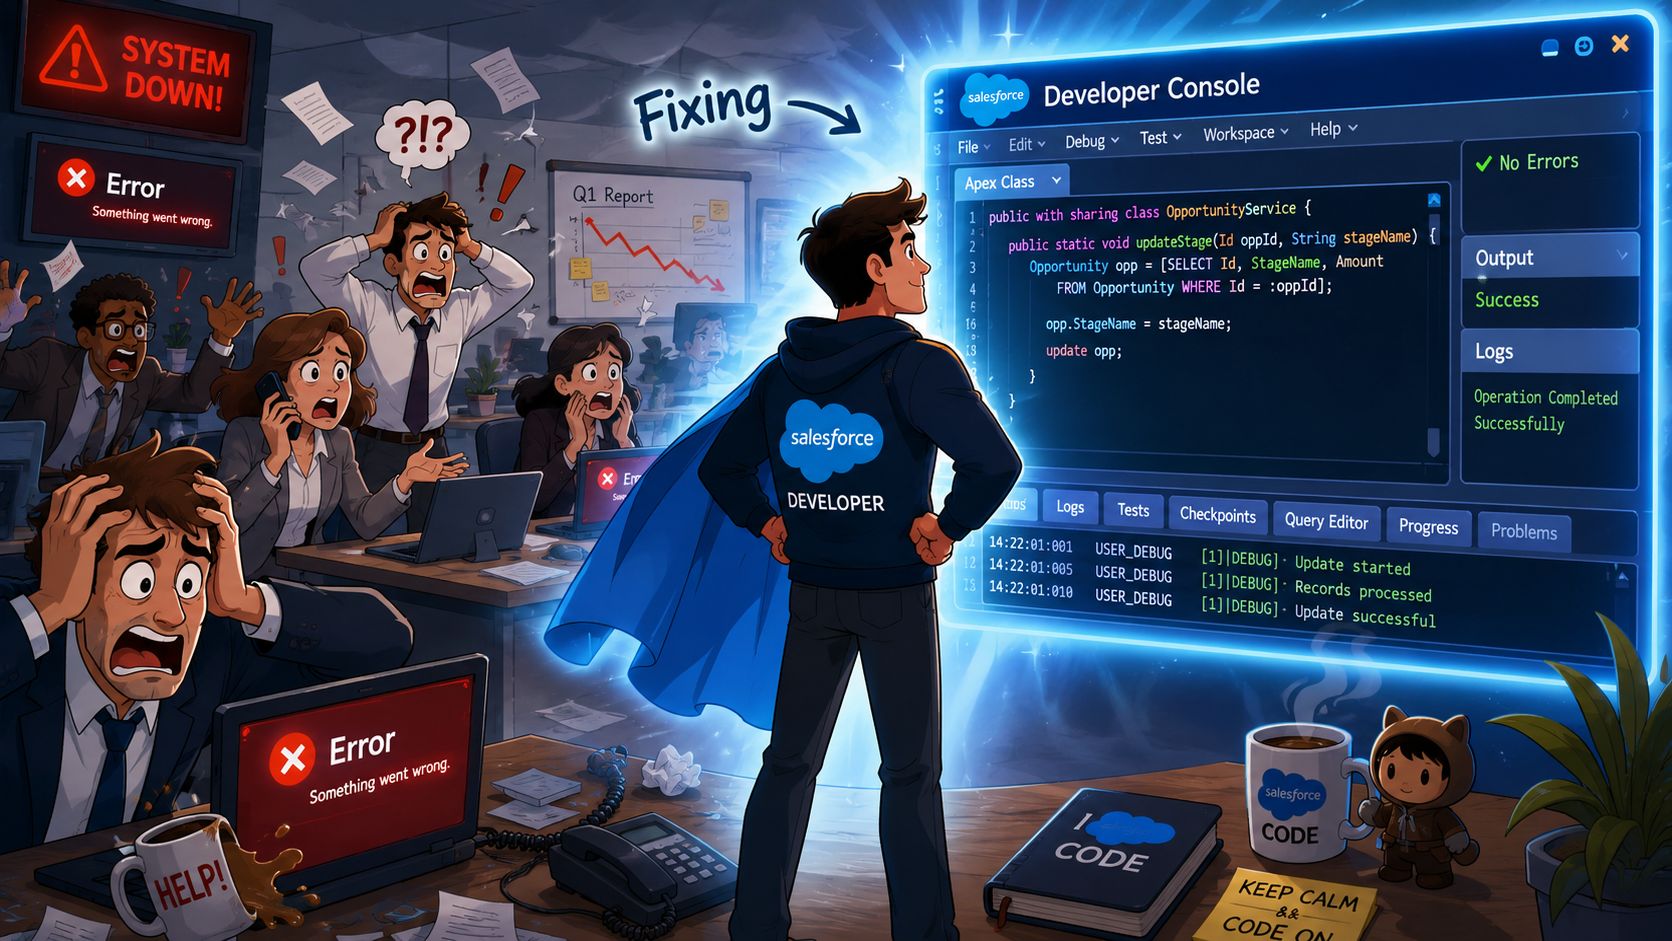
A Salesforce outage rarely begins as an “IT issue”. It starts as stalled quotes, failed case updates, broken approvals, or a finance workflow that suddenly won't save records. By the time it reaches leadership, the concern isn't code. It's revenue exposure, service disruption, and whether the platform team can isolate the fault before business users lose confidence.
That's where the Salesforce Developer Console earns its place. Developers often view it as a utility. In practice, it's one of the fastest built-in ways to inspect behaviour inside a live Salesforce org, trace execution, run targeted queries, and validate whether a problem sits in code, data, or transaction limits. For leaders responsible for platform stability, that makes it less of a niche screen and more of an operational control point.
Table of Contents
- The First Responder for Your Salesforce Platform
- What is the Salesforce Developer Console
- A Deep Dive into the Core Toolkit
- Strategic Troubleshooting and Debugging Workflows
- Console vs Modern IDEs When to Use Each
- Best Practices for Governance and Productivity
- Conclusion Driving Business Value from the Console
The First Responder for Your Salesforce Platform
When a critical process fails in the middle of the day, the first question is simple. Can the team diagnose the issue immediately, inside the system where the failure occurred? If the answer is yes, recovery is usually calmer, faster, and less disruptive.
The Salesforce Developer Console plays that first-response role well because it sits directly inside the org. Teams don't need to pause and build a local environment before they can inspect logs, review execution behaviour, or run a focused check. For support-heavy operations, especially where admins and developers share responsibility for production stability, that speed matters.
Salesforce itself operates at enterprise scale. A summary of Salesforce platform statistics notes $34.9 billion in revenue in 2023, up nearly 10% from $31.4 billion in 2022, with about 150,000 customers across 15+ industries and roughly 73,000 employees (Salesforce platform statistics overview). For an executive team, the message isn't just size. It's maturity. The developer console Salesforce teams use is part of a platform that large enterprises already depend on for operationally sensitive workflows.
Why leaders should care
A built-in console changes incident response in practical ways:
- Faster triage: Teams can inspect what happened without leaving the org.
- Lower tooling friction: Admins can often validate a problem before escalating it into a full development cycle.
- Better accountability: Logs and tests create a clearer chain between a business complaint and the technical cause.
Practical rule: The shorter the path from user complaint to reproducible evidence, the lower the operational risk.
For leaders reviewing their broader platform stack, it also helps to understand where this native console fits among other Salesforce tools. The best-run teams don't treat every issue as a coding task. They choose the fastest safe instrument for the situation, and the Developer Console is often that instrument when urgency is high.
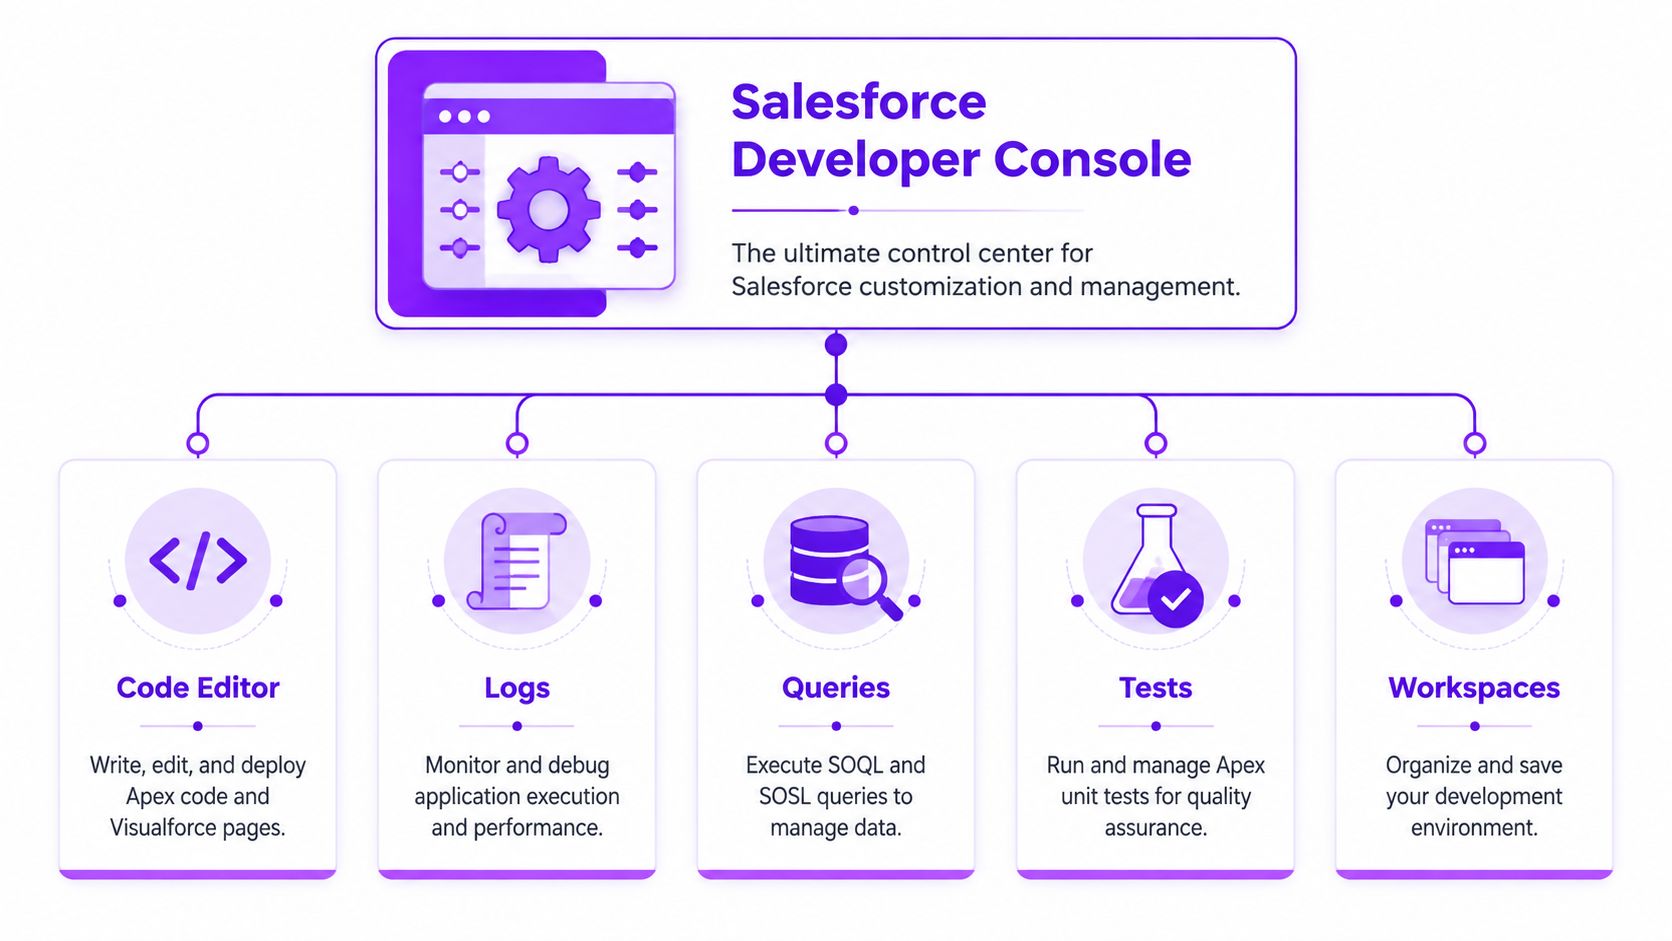
What is the Salesforce Developer Console
The simplest way to explain the Developer Console is this. It's the cockpit inside your Salesforce org. It gives authorised users a direct operational view into code execution, data inspection, debugging, and testing without needing to leave the browser and switch into a separate desktop workflow.
Salesforce Help describes it as an integrated development environment inside a Salesforce org, available from both Classic and Lightning Experience, combining tools for coding, debugging, and testing applications. Salesforce also states that it's available in Enterprise, Performance, Unlimited, Developer, and Database.com editions (Salesforce Help on Developer Console).
Who actually uses it
This isn't only for full-time developers.
Apex developers use it to inspect execution, run tests, and troubleshoot logic failures. Salesforce admins use it for faster checks, especially when a report or standard UI path is too slow for a targeted investigation. Technical leads use it to validate assumptions before assigning work across a team.
That built-in nature matters more than many teams realise. A browser-based workspace lowers the barrier for immediate action. When someone needs to check whether a trigger fired, whether a query returned the expected record, or whether a recent change caused an exception, they can often get the answer in one place.
Why native access matters operationally
External IDEs are stronger for structured engineering work, but the Developer Console wins on immediacy. It keeps teams close to the running org.
That means it's especially useful when you need to:
- Inspect live behaviour: Review logs generated by actual user activity.
- Validate data quickly: Run a query rather than build a temporary report.
- Test a narrow fix: Confirm whether a small code adjustment resolves a specific defect.
The console isn't the full development estate. It's the shortest route to platform truth when time matters.
For executives, the value is straightforward. A native workspace reduces delay during triage, lowers dependency on heavyweight setup for routine checks, and helps standardise how teams investigate issues inside Salesforce.
A Deep Dive into the Core Toolkit
The strength of the Developer Console isn't any single screen. It's the way several small tools combine into a fast troubleshooting loop. A user reports a failure. The team inspects the relevant logic, checks the affected data, reproduces the path, and validates a fix. Done well, this can happen without opening multiple systems.
Why the editor still matters
The source editor is where teams inspect Apex classes, triggers, and Visualforce-related components already tied to business logic. That may sound obvious, but the business implication is important. A large share of Salesforce operational risk sits in custom behaviour, not in standard objects alone.
When a workflow starts failing, teams need to answer questions like these:
- Which trigger or class executed?
- Did the logic account for this data state?
- Was the exception caused by sequence, validation, or dependency?
In the Developer Console, those answers sit closer together than they do in a fragmented toolchain. The editor won't replace a full development environment for project work, but it is highly effective for narrow investigation and targeted maintenance.
The fastest path for targeted actions
Two areas often produce immediate value: the Query Editor and Execute Anonymous.
The Query Editor gives teams a practical lens into org data. If a user says a record relationship is wrong, a filter isn't matching, or a process should have found a value but didn't, a quick query usually gives the answer faster than building a report or navigating multiple record layouts.
Execute Anonymous is even more powerful, and more sensitive. It lets an authorised user run short snippets of Apex directly. Used carefully, that's useful for surgical tasks such as validating a method call, updating a small set of records, or reproducing logic in a controlled way. Used carelessly, it can create avoidable production risk.
That trade-off is why mature teams treat it as a precision instrument, not a shortcut for bypassing process.
Here's the operational pattern that works:
- Confirm the problem first with logs or a query.
- Limit the scope of any anonymous execution to a tightly defined purpose.
- Record what was run so support and engineering retain an audit trail.
- Retest after execution rather than assuming the issue is resolved.
Small scripts solve real problems. Unreviewed scripts also create them.
Logs tests and inspection in one loop
Much of the inherent value in developer console Salesforce workflows comes from its debugging and testing loop.
Salesforce Help notes that the console is used to create, debug, and test applications, including Apex code coverage and unit, functional, and regression tests (Salesforce Help on logs and testing). For leadership, the significance is simple. The same native workspace can support both diagnosis and validation.
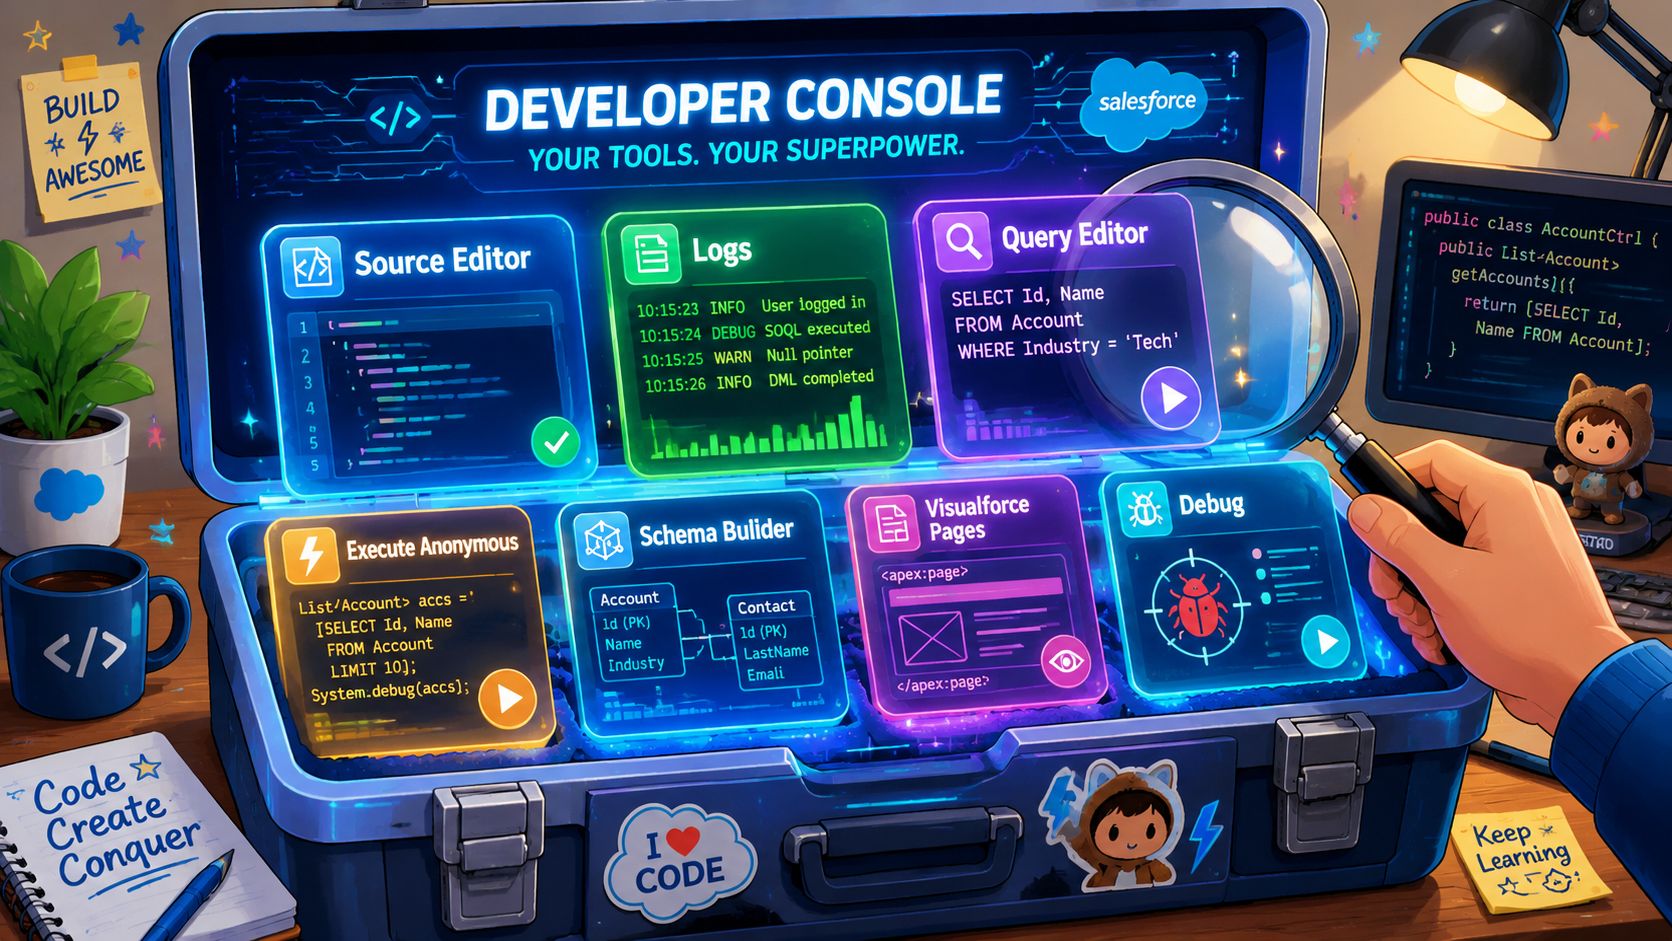
The practical toolkit usually looks like this:
- Debug Logs: Show the transaction path. This helps teams see where execution failed, what fired first, and whether a query or method created the fault.
- Log Inspector: Makes large logs more usable by helping users focus on the relevant events instead of reading raw output line by line.
- Checkpoints: Useful when a team wants to inspect application state at specific points without filling code with temporary debug statements.
- Test Runner: Confirms whether the fix holds and whether nearby logic still behaves as expected.
A quick visual walkthrough helps when you're introducing the console to a broader leadership or delivery audience:
How this toolkit translates into business value
The business case isn't that the console is flashy. It's that it reduces delay between issue detection and informed action.
A disciplined team uses the toolkit to improve three outcomes:
| Operational need | Console capability | Business effect |
|---|---|---|
| Rapid diagnosis | Queries and logs | Less time spent guessing |
| Safer remediation | Source inspection and targeted execution | Fewer broad changes for narrow faults |
| Controlled validation | Test execution in the same workspace | Better confidence before users resume work |
The organisations that get the most from the console don't over-romanticise it. They use it for immediate visibility, focused correction, and evidence-based testing.
Strategic Troubleshooting and Debugging Workflows
The Developer Console becomes most valuable when teams use it as a workflow, not a menu of features. The difference matters. Strong teams don't just know where the Query Editor sits. They know which sequence of actions gets a blocked user working again with the least risk.
Salesforce-focused guidance notes that the console can generate real-time logs, show detailed error messages, and reveal when governor limits are being hit, which is especially important in Apex-heavy orgs where runtime limits are enforced per transaction and failures may appear only under certain data loads or user paths (SalesforceBen on Developer Console troubleshooting).
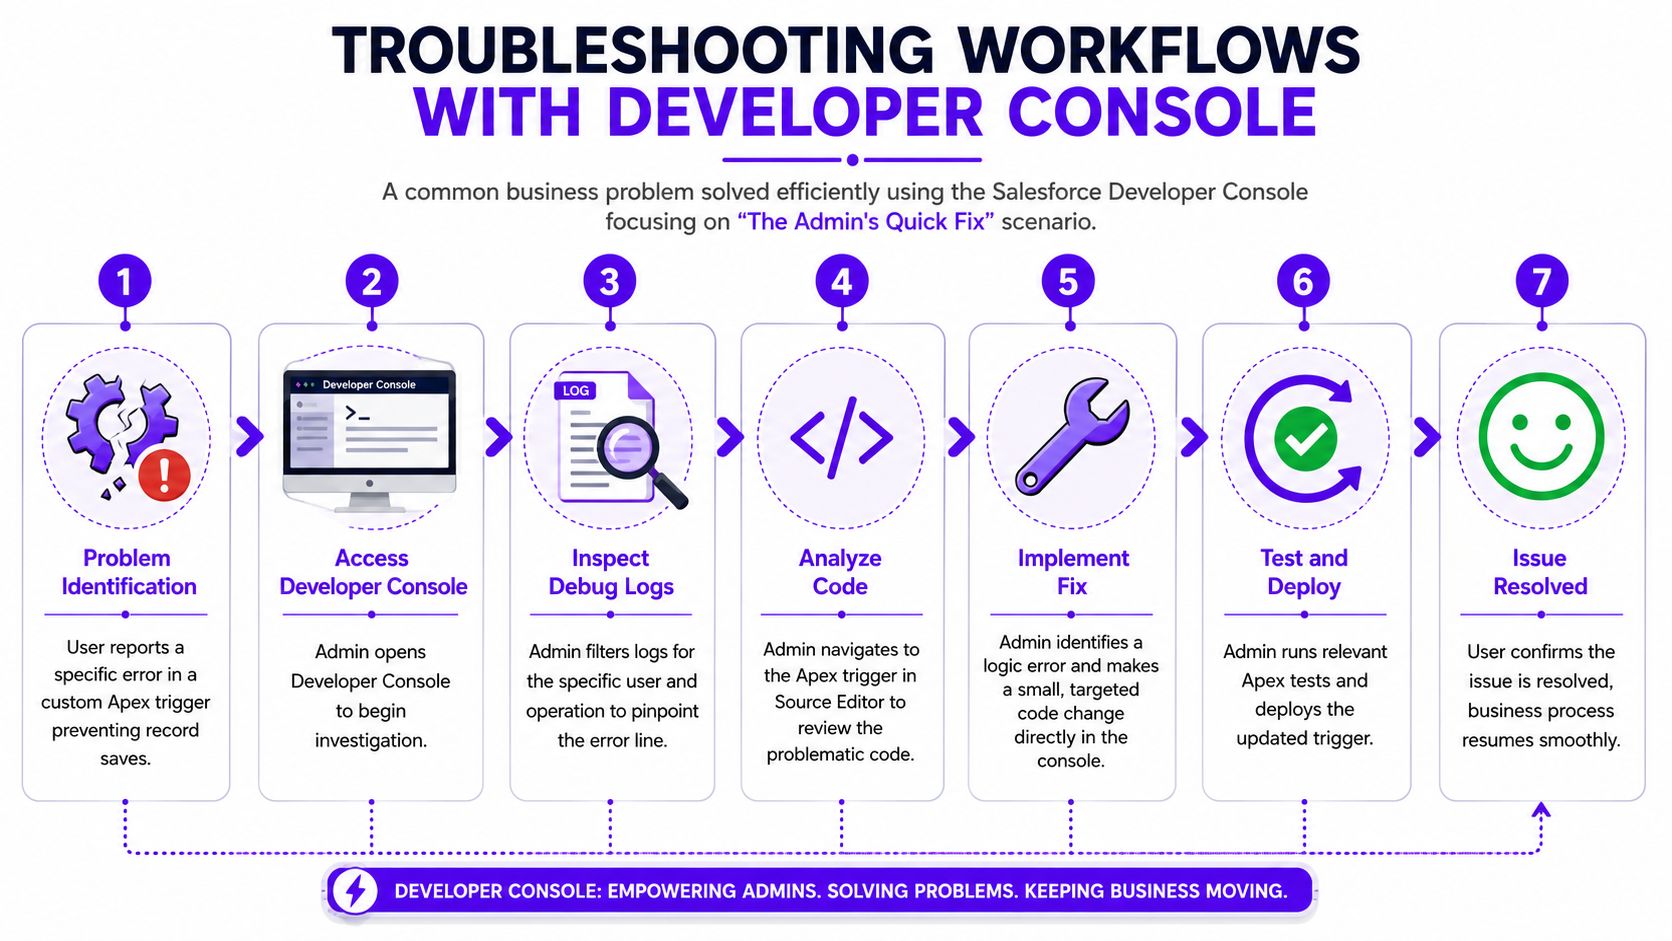
The admin quick fix
A common support scenario starts with a user who can't save a record. The error message is vague. Sales says the issue is urgent because it's blocking a live process.
A capable admin won't begin by changing fields at random. They'll narrow the problem:
- Identify the affected user and record path.
- Pull the relevant transaction context.
- Query the related data to check whether a missing or malformed value triggered the failure.
- Use the console to verify whether automation, custom logic, or data state is responsible.
The Developer Console often proves more effective than broad UI exploration, enabling the admin to inspect the problem close to the execution layer and hand over precise findings if a developer needs to step in.
If the root issue turns out to be bad input structure, a separate discipline such as validating patterns can also matter. Teams that rely on strict input rules often benefit from reference material like this regex for phone number guide, especially when malformed values create downstream failures in validation or integration logic.
A good admin investigation doesn't just say “it's broken”. It says what failed, where, and under which conditions.
The developer deep bug hunt
The harder scenario is the performance defect that appears only under certain conditions. A trigger works in testing but fails for one business unit, one batch path, or one user journey involving heavier related data.
That's where the console's debugging path becomes strategically useful.
A developer will typically:
- Reproduce the transaction as closely as possible.
- Capture the relevant debug log.
- Inspect execution order, query behaviour, and method calls.
- Look for limit consumption, recursion, or data-volume-sensitive logic.
- Use checkpoints or focused inspection to understand state at the point of failure.
- Validate the change with tests before closing the incident.
The important leadership takeaway is that this workflow reduces blind fixing. Instead of “patching until the error disappears”, the team can work from evidence. That lowers the chance of shipping a narrow fix that creates a wider regression.
Why this matters to executives
From a CXO perspective, the Developer Console supports a lower-friction incident model. It helps teams move from symptom to cause with less guesswork, and it gives both admins and developers a shared place to inspect platform behaviour.
That doesn't remove the need for process. It makes process faster and more informed.
Console vs Modern IDEs When to Use Each
A recurring management mistake is forcing a single preferred tool across every Salesforce task. That usually slows teams down. The better approach is to define when the Developer Console is the right choice and when a modern local environment such as VS Code with Salesforce CLI should take over.
The short answer is simple. The Developer Console is tactical. VS Code with CLI is strategic.
Where the Developer Console wins
The console is strongest when a team needs immediate, in-org access.
Use it when the work involves:
- Fast debugging: Inspecting logs or tracing a production-like issue quickly.
- Quick queries: Validating data relationships or field values without report-building overhead.
- Narrow test runs: Confirming behaviour around a targeted change.
- Admin-accessible diagnostics: Giving technically capable admins a way to investigate issues without full local setup.
Its main advantage is context. You're already inside the running environment, using a built-in workspace designed for coding, debugging, and testing.
Where VS Code with CLI is the better choice
Modern IDE workflows are stronger for structured engineering practice. If the work belongs in a delivery pipeline, local tooling is usually the right default.
That includes:
- Feature development across multiple files
- Source control and pull-request collaboration
- Team-based release management
- Larger refactoring efforts
- Project standards such as linting, packaging, and repeatable deployment steps
The trade-off is setup and process overhead. That overhead is worth it when the work affects maintainability, collaboration, and release quality.
A practical comparison
| Criterion | Salesforce Developer Console | VS Code with Salesforce CLI |
|---|---|---|
| Access speed | Immediate inside the org | Requires local setup |
| Best for | In-context debugging and quick checks | Structured development and team workflows |
| Typical users | Developers, admins, technical leads | Developers, architects, DevOps-oriented teams |
| Change scope | Small, targeted tasks | Broader project work |
| Governance strength | Depends heavily on operating discipline | Stronger alignment with source control and release process |
Use the console when speed and context matter most. Use a modern IDE when change control and collaboration matter most.
The most effective leadership policy isn't “pick one”. It's to define a clear operating model for both.
Best Practices for Governance and Productivity
The Developer Console can either sharpen your Salesforce operations or create avoidable exposure. The difference comes down to rules. Teams need clear boundaries for what can be done quickly in the org and what must move through a fuller engineering workflow.
Controls that reduce avoidable risk
Start with debug logs. They're useful, but unmanaged trace flags can create noise and distract teams from the actual issue. Teams should set them intentionally, review them regularly, and remove them when the investigation is complete.
Next comes Execute Anonymous. In this context, governance matters most. If someone can run code directly in an org, leadership should expect a lightweight but real control model.
That usually includes:
- Approval for production use: Small scripts can still alter live business data.
- Documented intent: Record what was run, why it was run, and what outcome was expected.
- Permission discipline: Not everyone who can view an issue should be able to execute code against it.
A strong supporting habit is to treat operational runbooks and remediation notes as living artefacts. Teams adopting a documentation as code guide often handle this better because they version decisions instead of burying them in chat threads.
Habits that improve daily speed
Governance alone doesn't make the console effective. Teams also need repeatable working habits.
A few that consistently help:
- Save investigation context: Use workspaces and named patterns so people can return to a debugging thread without starting again.
- Filter logs aggressively: Large logs are only useful if the team knows how to isolate exceptions, query behaviour, and execution sequence.
- Separate incident fixes from system redesign: The console is good for targeted correction. It's not where broader architectural debt should be managed.
For organisations running integrated Salesforce estates, this distinction gets even more important when multiple systems depend on the same transaction path. A useful background read for those operating models is this overview of inbound and outbound integration in Salesforce, because many console investigations eventually trace back to integration timing, payload quality, or handoff logic.
Good governance doesn't slow teams down. It prevents fast actions from becoming expensive ones.
Conclusion Driving Business Value from the Console
The Salesforce Developer Console is easy to underestimate because it's built into the platform and always close at hand. That's exactly why it matters. It gives admins, developers, and technical leads a direct workspace for diagnosing problems, validating logic, and restoring confidence when business processes are under pressure.
For leadership, the value is operational. Better triage, quicker fault isolation, safer targeted fixes, and clearer governance around how teams work inside a core system. Used well, the developer console Salesforce teams rely on becomes part of the platform's control layer, not just a developer convenience.
If your organisation depends on Salesforce for customer operations, service workflows, or lead handling, this belongs in the wider conversation about platform discipline and CRM execution. That broader lens is worth connecting to your CRM and lead management strategy.
If your team is strengthening the systems around Salesforce, especially customer operations, lead qualification, and support workflows, DialNexa Labs Private Limited can help you scale those conversations with Voice AI agents designed for real business processes. Explore how their platform supports qualification, support, recruitment, and presales without heavy setup.
Leave a Reply