Unlock a Data Flow Diagram for Hotel Management System to Streamline Operations
Think of a data flow diagram for a hotel management system not as a dry technical chart, but as a strategic map of your entire enterprise. It traces every piece of information, from a guest's first online search to their final checkout bill. For any executive serious about operational excellence, this isn't just about IT—it's a tool for identifying hidden inefficiencies, cutting operational costs by as much as 15-20%, and dramatically improving the guest experience.
Why Data Flow Is Your New Strategic Blueprint
For too long, data flow was delegated to the tech team. That era is over. A well-crafted data flow diagram (DFD) demystifies complex, often invisible processes and presents them in a clear, visual format. It becomes your definitive blueprint for understanding how your hotel actually functions, versus how you think it does.
Once you have this map, operational vulnerabilities become glaringly obvious. By following the path of data from a booking engine click to a settled bill, you can pinpoint the exact points where friction slows down service and inflates costs. Are check-in queues long because housekeeping status updates suffer a 15-minute delay in reaching the front desk? Does the finance team waste 10 hours a week reconciling fragmented payment details from different systems? A DFD doesn't just hint at these problems; it quantifies them.
Connecting Data Flow to Business Outcomes
This is where a DFD proves its strategic value—by linking operational minutiae directly to your most critical business metrics. A clunky, disjointed booking process, for example, doesn't just frustrate potential guests; it actively erodes your conversion rates and top-line revenue.
A luxury hotel chain we partnered with used a DFD to diagnose a critical revenue leak: their front desk was overwhelmed with reservation calls they couldn't handle, leading to an estimated $500,000 in lost annual booking opportunities. By integrating a Voice AI agent to manage this call volume and feed structured data directly into their CRM and booking systems, their lead-to-booking conversion rate shot up from a mere 2% to an impressive 8%.
This is a powerful illustration for any hospitality CXO. Fine-tuning your data flow is not a theoretical exercise. It has a measurable impact on your bottom line, influencing everything from your Revenue Per Available Room (RevPAR) to your Average Daily Rate (ADR).
A Strategic Tool for a Growing Market
With India's hospitality sector poised for significant growth—hotel revenues are projected to climb by 9-12% in FY26 and average room rates are expected to hit INR 8,200-8,500—operational efficiency is non-negotiable. Take a mid-sized hotel in Mumbai that saw 76% occupancy in early 2024. A DFD would show just how critical it is to seamlessly manage the 40% of reservations now coming from online travel agencies.
Understanding this flow is essential for scaling up without chaos. As we've seen at DialNexa, combining DFD insights with tools like Voice AI agents allows our clients to handle this surge in volume without a hitch. You can read more on how the Indian hotel industry is gearing up for this expansion in this detailed economic report.
Ultimately, a clear DFD gives you the oversight needed to make smarter technology investments and justify them to the board. It ensures that every new tool, whether it's a CRM or an automated agent, is acquired to solve a specific, profit-driven problem. This strategic mindset is gaining traction, as shown in various data modeling use cases across industries that highlight its universal value in boosting profitability.
Making Sense of the Squiggles: A Leader’s Guide to DFDs
As a VP or Director, you don’t need to draw complex diagrams. That's what your technical team or partners are for. However, knowing how to interpret a data flow diagram for a hotel management system is a critical leadership skill—it’s your key to steering your hotel's technology strategy and ensuring investments deliver measurable ROI.
Let's cut through the technical jargon. A DFD is simply a business process map. Once you learn to see the familiar rhythm of your operations in its lines and boxes, you can engage in far more strategic conversations with your IT department. You'll be equipped to ask sharp, insightful questions, challenge assumptions, and ensure the final system architecture actually makes life easier for your staff and more delightful for your guests.
From Technical Symbols to Hotel Realities
At first glance, a DFD can look like a confusing mess of shapes and arrows. In reality, it has only four core components, each with a direct, tangible counterpart in your hotel’s daily operations.
By mapping these abstract symbols to entities you already manage—guests, tasks, and data repositories—the entire diagram becomes a powerful tool for visualizing business performance.
A data flow diagram breaks down your hotel's operations into four key elements. The table below shows what these technical symbols really represent in a practical, hotel context.
DFD Components in a Hotel Management Context
| DFD Component | Symbol | Hotel Management Example | Business Significance |
|---|---|---|---|
| External Entity | Rectangle | A Guest, a Corporate Client, an Online Travel Agency (OTA), or a Payment Gateway. | These are the sources of your revenue and key ecosystem partners. The diagram visualizes the efficiency of these interactions. |
| Process | Circle/Rounded Rectangle | Guest Check-In, Process Payment, Update Room Status, or Generate Housekeeping Report. | These are the core actions your team performs. Mapping them helps identify bottlenecks and opportunities for automation that can reduce FTE costs. |
| Data Store | Two Parallel Lines | Your Guest History Database, the Room Inventory, or Billing Records. | This is your hotel’s institutional memory. The diagram reveals what information you capture and how it’s leveraged (or underutilized). |
| Data Flow | Arrow | A Booking Request from a guest, a Payment Confirmation to the billing system, a Clean Room Notification from housekeeping. | This shows how information moves between departments. It helps you spot communication gaps that cause delays and service failures. |
With this simple translation, a complex diagram becomes a readable map of your hotel's daily functions. You can clearly trace how a booking request from an OTA ultimately becomes a settled transaction in your financial records, identifying every touchpoint along the way.
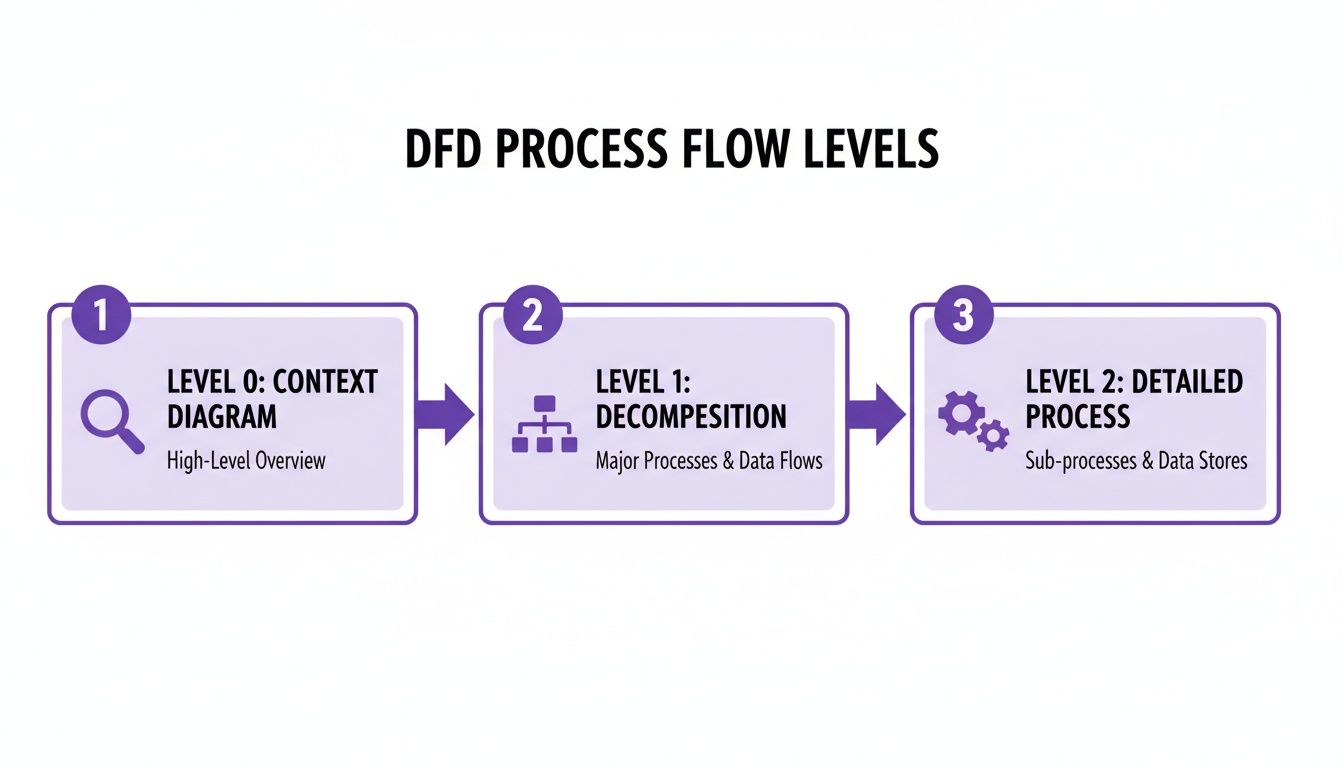
Choosing the Right Altitude: DFD Levels Explained
Data flow diagrams aren’t a one-size-fits-all tool. They’re organized into different levels of detail, which is incredibly useful for communicating with everyone from your board members to your front-desk manager.
A Level 0 DFD, or Context Diagram, is the 30,000-foot executive view. It shows your entire hotel management system as a single process, highlighting its interactions with external entities. This is the perfect slide for a board meeting to illustrate how the hotel engages with guests, suppliers, and booking partners without getting lost in technical minutiae.
For a Director of Operations, this high-level view is gold. It frames the entire guest journey from an external perspective, making it easier to spot which partnerships—whether it’s a new payment gateway or a corporate booking platform—are creating data friction or offering the biggest opportunity for growth.
Go one level deeper to a Level 1 DFD, which breaks the main system into its major functions. Here, you’ll see distinct processes like ‘Reservations’, ‘Front Desk Operations’, and ‘Billing’. It’s the ideal view for department heads to see how their operations influence and depend on one another. For instance, the Head of Sales can visualize how corporate bookings directly impact the front desk's check-in queue and staffing needs.
Finally, a Level 2 DFD zooms in on a single process from Level 1, offering a granular, ground-level view. You could create a Level 2 diagram for ‘Front Desk Operations’ that details every sub-process: ‘Verify Guest Identity’, ‘Assign Room Key’, and ‘Process Pre-Authorization’. This is where a manager can troubleshoot specific operational snags. The Head of F&B, for example, could use a Level 2 diagram of the room service process to pinpoint why guest orders are delayed by an average of 7 minutes between the kitchen and the guest’s room.
Understanding these layers empowers you to ask the right questions at the right altitude, ensuring your technology roadmap is built to serve business strategy, not the other way around.
Using a DFD to Map the Front Desk Experience
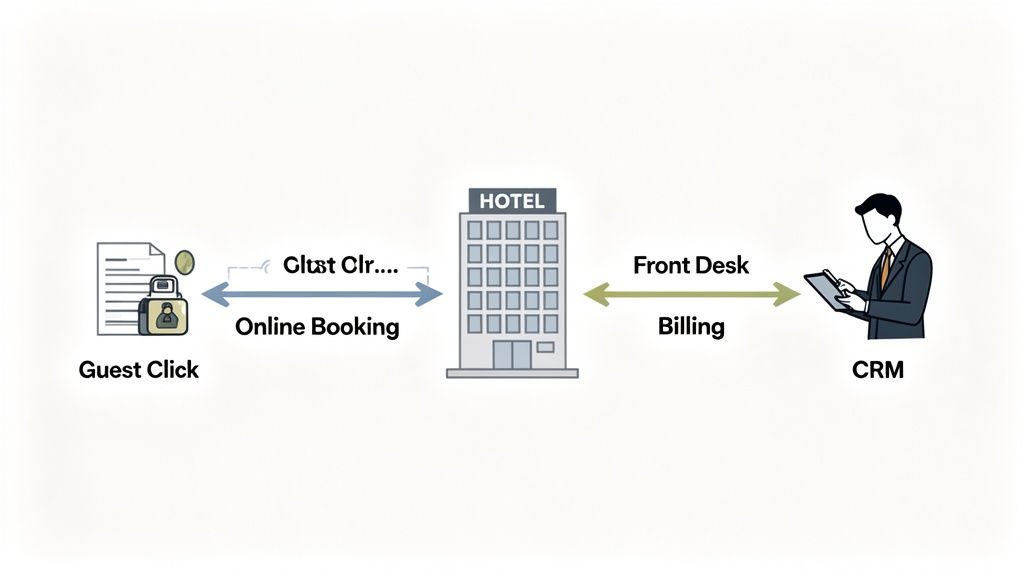
With the basics of DFDs under our belts, let's get practical. The front desk is the nerve center of your hotel; it's where first impressions are forged and where the guest experience truly begins. By creating a data flow diagram for a hotel management system that focuses on this critical area, we can get a clear, visual map of every interaction that impacts guest satisfaction and operational efficiency.
Think of it as tracing the journey of guest information. It starts when an 'Online Booking Confirmation' arrives. This single piece of data acts as a trigger for the 'Front Desk Management' process, setting off a cascade of data handoffs that must occur seamlessly.
For instance, the system must query the 'Room Status' data store to find an available, clean room. Concurrently, it has to send a 'Payment Pre-Authorization' request to the 'Billing System'. Each arrow on the diagram represents a "conversation" between different parts of your operation. When these conversations are instant and accurate, the guest experience is frictionless. When they are delayed or broken, service quality deteriorates.
This kind of visualization allows you to zoom from a 30,000-foot view to the ground-level details, showing you exactly where you can make the biggest strategic improvements.
As the diagram above shows, DFDs are built in layers. You start with a simple Context (Level 0) diagram and then decompose it into more detail at Level 1 and Level 2. This structure is invaluable for executives, as it allows you to discuss operations at the appropriate level of detail for any audience, from a high-level strategy meeting to a weekly departmental huddle.
Uncovering Hidden Friction Points
For a hotel director, a DFD is more than a technical diagram—it's an X-ray of your operational health. It instantly highlights the hidden bottlenecks that lead to a poor guest experience and decreased profitability.
I've seen this time and again: a 10-minute delay between housekeeping marking a room as "clean" and the 'Room Status' database actually updating. It seems small, but that lag means the front desk cannot assign the room. The result? Guests are stuck waiting in the lobby, with satisfaction scores dropping by an average of 15% for every 5 minutes of extra wait time, even when clean rooms are sitting empty.
By mapping these data flows, you draw a straight line from a technical delay to a business problem—like a drop in your Net Promoter Score (NPS). It provides the hard evidence you need to justify investing in real-time communication tools or re-engineering a process.
A DFD also clarifies where new technology can deliver the best ROI. It shows exactly how integrating a new payment gateway or a mobile key system can eliminate manual data entry, reduce transaction times by up to 60 seconds per guest, and free your staff to focus on high-value, personal service. This visual approach to process improvement is a core part of a wider strategy, which you can explore by reading more about customer journey mapping techniques in our detailed guide.
A Look at Data Flow in Action
The logic behind a DFD is universal. A guest arriving at the front desk triggers data flows to room management and billing, just as a customer's order in a restaurant triggers flows to the kitchen and payment systems. An external request comes in, and the system processes and routes it to get the job done.
This structured thinking is especially critical in high-growth markets. A data flow diagram for front-desk operations in India's booming hotel sector reveals how digital systems are essential for managing record performance. The industry's RevPAR recently hit INR 6,400-6,730 (an 11-13% YoY increase), driven by a surge in tourism.
For a hotel in Delhi, for instance, the 'Front Desk' process has to handle data from online travel agents, airport shuttles, and a flood of online check-ins. A well-designed DFD helps manage this high volume, ensuring the system can handle thousands of concurrent inputs and outputs without buckling under pressure—a key factor behind successes like ITC Hotels' 24% revenue jump to INR 1,280 Cr.
At the end of the day, optimizing these data flows at the front desk isn't just a technical exercise. It leads directly to a smoother, more memorable journey for your guests and a healthier bottom line for your business.
Optimising Your Back-of-House Engine
While the front desk may be the face of the hotel, the back-of-house is the engine that drives operational excellence. Housekeeping and inventory management are where efficiency is won or lost. A well-designed data flow diagram for a hotel management system is not just a theoretical exercise; it’s a practical blueprint for transforming these cost centers into powerful profit drivers.
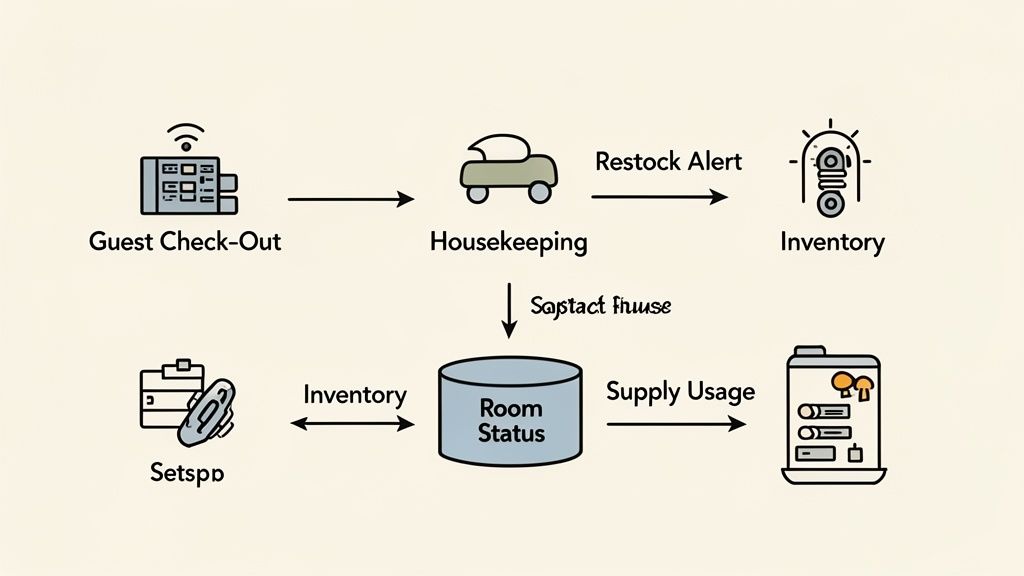
Consider the chain reaction that happens hundreds of times a day. It begins the moment a guest checks out. This single event sends a 'Guest Check-Out' data signal to your central system, which instantly dispatches a 'Room Cleaning' task to the housekeeping team's mobile devices. No more waiting for a phone call or a printed list.
Once the room is ready, a quick tap on their app sends a 'Room Clean' status update back to the 'Room Status' data store. This simple, automated flow provides the front desk with a live, accurate inventory of available rooms. The business impact? A 25% reduction in room turnover time, no more frustrating check-in delays for weary travelers, and a measurable lift in guest satisfaction.
From Manual Counts to Automated Alerts
The efficiency gains extend far beyond room turnover. As housekeepers use supplies, they log consumption through the same app. This 'Supply Usage' data flows directly into your inventory management process. This isn't just about record-keeping; it's about active resource management.
When linens, toiletries, or other essentials dip below a predetermined threshold, the system automatically triggers a 'Restock Alert' for the inventory manager. This is how you prevent costly and embarrassing stockouts, especially when you're at 95% occupancy during peak season. A task that was once a manual, time-consuming chore is now a proactive, automated workflow. For any Director of Operations, this DFD is proof of how smart data flow directly prevents service failures and protects the brand.
A simple investment in IoT sensors for minibars can elevate this even further. When a guest picks up a snack, the sensor sends a signal that simultaneously updates the billing system to add the charge and alerts the inventory system for restocking. This one data point eliminates manual checks, can cut down on waste by up to 20%, and ensures every bit of revenue is captured.
This level of connectivity transforms the back-of-house from a reactive department into a data-driven machine that directly boosts the bottom line.
Back-of-House in a High-Growth Market
Having a solid data flow diagram for inventory and housekeeping becomes absolutely critical in a booming market, like the Indian hotel industry which is eyeing a 13.96% CAGR through 2033. For instance, a detailed Level 2 DFD for 'Housekeeping Scheduling' can use projected occupancy data (often hitting 72-74%) to automatically generate staff rosters, optimizing labor costs. This becomes even more powerful when factoring in IoT sensors—expected in 30% of new Tier-2/3 hotel builds—for real-time cleanliness updates.
With a pipeline of 88,000 rooms, frameworks like these are vital for cutting waste and adopting modern, asset-light operational models. You can dig into more of these trends in this market intelligence report.
Better yet, the data gathered from these back-of-house workflows can provide intelligence to other parts of the business. As we explore in our 2024 case studies on speech technology in hospitality, insights from operational data can help refine how AI agents handle bookings and guest service requests. This holistic view ensures every part of your hotel—from the linen closet to an AI-powered phone line—is working in concert to create a seamless and profitable operation.
Turning Your Diagram into a Deployment Strategy
A well-crafted data flow diagram for a hotel management system is more than just a technical drawing; it's a map of your hotel's operational pulse. But for any director or VP, a diagram sitting in a file generates zero ROI. Its true function is to guide action and drive tangible business results.
This is where leadership transforms a blueprint into a strategy. It’s about selecting the right tools, asking the tough questions, and weaving these data flow insights into your tech stack to drive continuous improvement and competitive advantage.
Choosing the Right Collaborative Tools
First, liberate your diagram from a static file and place it in a dynamic, collaborative environment. Tools like Miro or Lucidchart are ideal for this. They aren’t just for drawing; they’re collaborative canvases where you can bring everyone to the table, from the front desk manager to the head of F&B and finance.
Imagine sharing a live diagram where your Head of Housekeeping can highlight a process and state, "Actually, that alert doesn't pop up on our app; we still get a printout from the front desk every two hours." This is operational gold. That kind of immediate, real-world feedback transforms a theoretical workflow into an accurate snapshot of reality, validated by the very people executing the process.
As a leader, your role isn't to draw every line and arrow. It's to facilitate the conversation. The objective is to get every key stakeholder to see their part of the operational puzzle and agree on how information should flow to optimize performance.
This collaborative process builds buy-in from the ground up. When it's time to roll out a new system or process change, your team is already invested because they helped architect the 'why'.
The Strategic Review Checklist for Leaders
Once your DFD is a solid, collaboratively-approved map, it's time to put on your strategic hat. A DFD is a goldmine for optimization opportunities, but you need to know what you're looking for.
Use this checklist to analyze your diagrams and identify high-impact areas for improvement:
- Hunt for Automation Hotspots: Where is manual data entry creating delays or errors? A classic example is staff copying booking details from an OTA email into your HMS. This is a prime candidate for an API integration that could easily save 5-10 hours of staff time per week and eliminate data entry errors.
- Gauge the Guest Service Impact: Does this data flow enhance or detract from your premium service promise? If a guest's preferences—collected at booking—are not instantly available to the concierge and restaurant host, you're missing a critical opportunity to personalize their stay and drive ancillary revenue.
- Spot the Data Silos: Is valuable information trapped in one department? Housekeeping's supply usage data is vital for the procurement team's forecasting. If it's locked in a spreadsheet on a local computer, you're likely overspending on inventory by 5-10%.
- Check for Security & Compliance Gaps: Where is sensitive guest data moving or stored? Your DFD can expose risks, like unencrypted payment details in temporary log files, helping you fortify your PCI DSS compliance and protect your brand's reputation.
Integrating DFD Insights with External Platforms
The final, most crucial step is using your DFD to guide the integration of external platforms. This is how you build a modern, interconnected hotel that works smarter, not harder.
For instance, your diagram might starkly reveal that the front desk team spends 30% of its time answering the same routine booking questions.
That's not just an observation; it's a solid business case. It shows you exactly where connecting your HMS to a Voice AI system would have the biggest impact. This isn't just about adopting new technology; it's a strategic move to redirect a major data flow. Now, routine calls are handled automatically 24/7, and the call data—guest details, booking intent, special requests—flows directly into your CRM. As we explore in our article on AI voice agents for hotels, this enriches your guest profiles and can directly boost lead conversion by capturing inquiries that would otherwise be lost.
By taking these steps, your DFD evolves from a static chart into a dynamic deployment strategy. It becomes a living document that guides your tech investments, refines your operations, and ultimately creates a superior experience for your guests and a healthier bottom line.
Executive FAQs on Hotel Management DFDs
You’re busy running a hotel, not drawing diagrams. You need the bottom-line impact of any new initiative. Let's cut to the chase and answer the real-world questions we hear from VPs and Directors about using a data flow diagram for a hotel management system.
Is This Just Another IT Project or a Real Business Tool?
Frankly, if it stays with the IT team, it's an academic exercise. But when sponsored and utilized by leadership, it’s one of the most powerful business strategy tools available. Think of it less as a technical drawing and more as an MRI of your entire operation, revealing exactly how information, tasks, and revenue flow through your property.
For a director, this is invaluable. It helps you move from diagnosing vague problems ("guest satisfaction is down") to specific, solvable issues. For example, a DFD could reveal that housekeeping's "room ready" updates are delayed by 12 minutes on average, causing a bottleneck at the front desk during peak check-in. Suddenly, you're not just dealing with unhappy guests; you're solving a specific data communication lag that has a direct impact on your NPS scores.
How Much Time and Resources Does This Realistically Take?
The initial effort is front-loaded, but it’s an investment that pays for itself by preventing costly operational inefficiencies and flawed technology implementations. For a typical mid-sized hotel, getting the foundational diagrams in place usually involves a few focused workshops with your department heads.
- Initial Mapping (Level 0 & 1): Budget around 20-30 hours of collaborative work with key stakeholders.
- Validation & Refinement: Another 10-15 hours with front-line staff to confirm accuracy and capture real-world exceptions.
The real ROI comes from what this process prevents. Industry data shows that fixing a system error post-deployment can be up to 100 times more expensive than catching it in the design phase. A DFD is your best defense against those costly design flaws.
What’s the Most Common Mistake Companies Make with DFDs?
The biggest mistake is treating the DFD as a one-and-done project. They create a beautiful diagram, file it away, and it gathers digital dust. A DFD must be a living document that evolves with your business; it is the starting point for continuous improvement, not the end of a project.
Another classic pitfall is creating it in an IT silo. A diagram is fundamentally flawed if it doesn't include input from the people executing the processes every day—the front desk agents, the restaurant managers, the head of housekeeping. Their on-the-ground knowledge is what makes the diagram an accurate and useful tool for decision-making.
A DFD should be a conversation starter between departments. When your Head of F&B can visually show the Director of Finance how a slow payment terminal is backing up the entire kitchen and costing an estimated $2,000 in lost table turnover per week, you build a culture of shared, data-driven problem-solving.
How Can a DFD Help Me Justify New Technology Investments?
This is where a DFD becomes a CXO's best friend. It helps you build an undeniable, data-backed business case. Instead of saying, "We need a new booking system," you can present a diagram that clearly shows your current system has a 40% abandonment rate at the payment stage because it fails to support popular digital wallets, representing a significant revenue leak.
You transform a subjective request into an objective, evidence-based proposal. You can show stakeholders precisely where the current system is bleeding revenue and model the exact ROI of a new solution. For example, you can map out how integrating a Voice AI agent to handle routine reservation calls could free up 15-20 hours of front desk staff time each week, directly connecting the investment to reduced labor costs and improved guest service capacity.
What Is the First Actionable Step I Should Take?
Don't start by opening a diagramming tool. Your first move is to assemble the right people. Schedule a two-hour workshop with a small, cross-functional team: your Head of Operations, Front Desk Manager, and a representative from your IT team or technology partner.
The objective is simple: map the guest check-in process on a physical or digital whiteboard. Don't get bogged down in formal notation. Just use simple boxes and arrows to trace the flow of information and actions from the moment a guest arrives until they have their key.
This simple exercise is guaranteed to expose misalignments and incorrect assumptions between departments. It's a low-cost, high-impact way to demonstrate the DFD's value and build the momentum needed for a more comprehensive, strategic initiative.
Ready to turn your hotel's operational data into a strategic advantage? At DialNexa, we help hospitality leaders connect their systems with intelligent Voice AI to automate routines and enrich the guest experience. Discover how our tailored solutions can help you act on the insights from your DFD by visiting https://dialnexa.com.
[…] If your team needs a structured way to do this before drawing UML, these Business Process Mapping Techniques are useful because they help separate user actions, approvals, and system-triggered events. For downstream system design, it also helps to compare the use case diagram with a more process-oriented model such as a data flow diagram. A practical reference is this resource on https://dialnexa.com/blogs/data-flow-diagram-for-hotel-management-system/. […]