
Performance Reporting: Drive Growth & Efficiency
$7.1 billion to $29.4 billion. That's the projected expansion of the global performance analytics market from 2026 to 2034, at a 17.1% CAGR, according to Straits Research on the performance analytics market. Boards should read that for what it is: a signal that performance reporting has moved out of the back office and into the strategy room.
Most organisations still report activity. Fewer report outcomes. Fewer still report whether those outcomes can be repeated, scaled, and linked to revenue, cost control, and execution risk. That gap matters. A dashboard that says calls were handled, leads were contacted, or workflows were automated may look efficient while hiding failure at the point directly affecting bookings, retention, or compliance.
The most useful reporting systems now work on a different principle. They are resolution-aware. They tell directors whether work was completed in a way that produced business value, whether the customer journey held together under real conditions, and whether the underlying process is improving or appearing busy.
Table of Contents
- From Rear-View Mirror to Windscreen
- The Evolution of Performance Reporting
- Choosing Your Strategic Reporting Framework
- How to Design a High-Impact Reporting System
- Performance Reporting Across Key Industries
- Automating Data Capture with Voice AI
- Turning Data into Your Decisive Advantage
From Rear-View Mirror to Windscreen
A one-day reporting delay can hide the exact moment revenue starts leaking. In customer operations, that usually appears first as a small rise in latency, repeat contacts, or abandoned journeys. By the time those signals reach a monthly board pack, the commercial damage has already occurred.
That gap explains why boards need a different standard for performance reporting. Traditional reports summarise activity. Resolution-Aware Reporting tests whether activity produced the intended outcome. An automation program, for example, should not be judged by containment volume alone. It should be judged by whether issues were resolved, whether customers stayed, and whether service costs fell without depressing conversion or retention.
The distinction is material. A support function can report strong bot usage while first-contact resolution falls and escalations rise. A sales team can show high outbound volume while meeting quality deteriorates and pipeline conversion weakens. In both cases, the report flatters execution while obscuring economic performance.
Board-level test: If a metric cannot support budget reallocation, ownership changes, or early intervention, it is measuring motion rather than business performance.
Data reliability also becomes strategic at this juncture. Stale pipelines, delayed syncs, and ageing extracts can make a healthy operation look weak, or a weak one look acceptable. For teams reviewing governance risks in reporting design, digna on preventing data disasters offers a useful perspective on how stale data distorts operational judgement.
Speed alone is not the answer. Faster dashboards only improve decisions when they capture the few signals that predict business outcomes. That is why leadership teams are reassessing how real-time monitoring in operations should feed board reporting. The highest-value use case is not visibility for its own sake. It is spotting the hidden breakpoints that standard reports miss, such as brief latency spikes that coincide with customer abandonment, repeat contact, or a drop in booked revenue.
The Evolution of Performance Reporting
Performance reporting used to be an archive. Today, it is becoming an operating system for management.
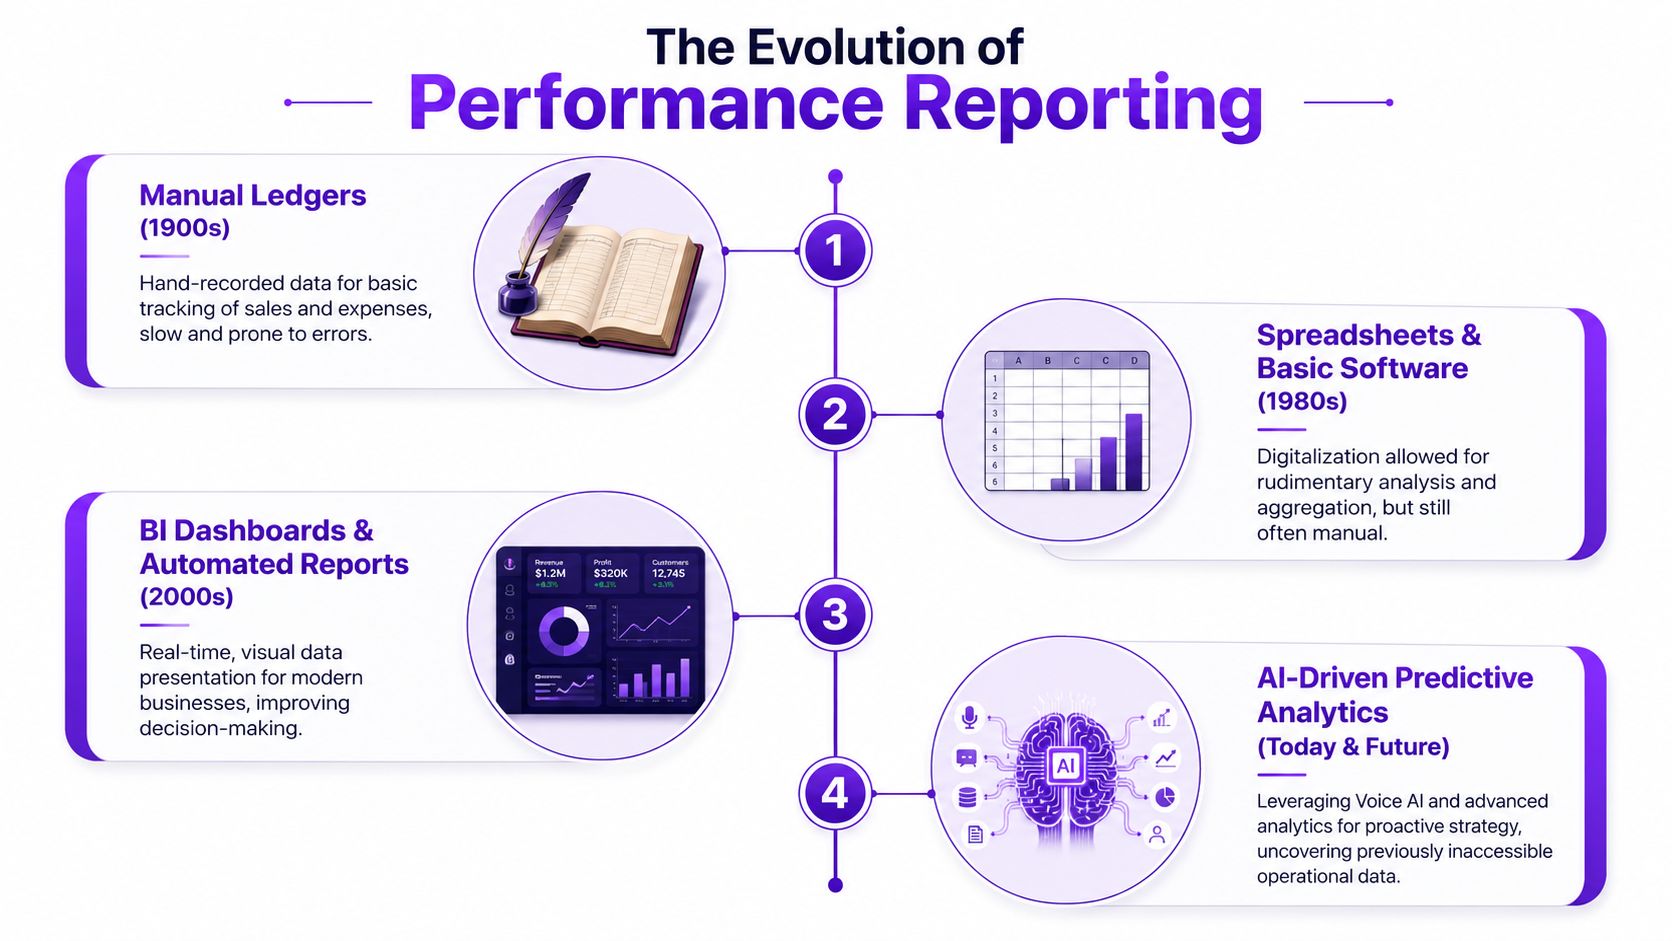
Reporting as the organisation's nervous system
The clearest way to understand modern performance reporting is to treat it as the organisation's central nervous system. Sales, operations, finance, customer service, and delivery all generate signals. Reporting gathers those signals, translates them into patterns, and pushes them to the people who can act.
That's different from performance management. Performance management is the set of actions leaders take. Performance reporting is the intelligence layer that tells them where to act, how fast to move, and which trade-offs are worth making. If the reporting layer is weak, management quality falls with it.
A mature system does three things at once:
- Connects strategy to operations: It links enterprise goals to daily execution rather than treating KPIs as isolated counters.
- Shows trend, not only snapshot: It helps leaders distinguish a short-lived fluctuation from a structural decline.
- Supports intervention: It identifies where a manager should step in before a missed target becomes a missed quarter.
What changed in practice
The market data confirms the methodological shift. The employee performance management market is projected to grow from USD 3.52 billion in 2025 to USD 6.33 billion by 2030, at a 12.4% CAGR, driven by the move from annual appraisals to continuous, analytics-driven feedback systems, according to MarketsandMarkets on employee performance management.
That projection matters because it reflects a broader operating change. Organisations no longer wait for end-of-cycle reviews to understand performance. They're building continuous loops where data appears faster, exceptions are easier to spot, and corrections happen inside the reporting period rather than after it.
Reporting becomes valuable when it compresses the distance between signal and decision.
For a VP, that can mean detecting a drop in qualification quality before pipeline conversion deteriorates. For an operations director, it can mean spotting rising transfer patterns before staffing costs spike. For a CHRO, it can mean seeing whether a team's coaching rhythm is improving outcomes or merely generating more check-ins.
Modern performance reporting isn't more paperwork. It's more usable intelligence.
Choosing Your Strategic Reporting Framework
A reporting system fails long before the dashboard is built if the framework underneath it is wrong. The central choice for many leadership teams is whether they need a model that balances competing priorities across the enterprise, or one that drives concentrated movement against a narrower set of ambitious goals.
When a Balanced Scorecard fits best
The Balanced Scorecard works well when directors need a disciplined view across multiple dimensions of performance. It forces management to report beyond finance and show what is happening with customers, internal processes, and organisational capability.
That matters in businesses where trade-offs are constant. A BFSI firm may improve speed while increasing compliance exposure. A healthcare platform may raise booking efficiency while weakening patient follow-through. The Balanced Scorecard helps boards see those tensions in one place.
It is especially useful when:
- The organisation is mature: Functions are established and need alignment more than speed.
- Risk trade-offs matter: Leaders must weigh cost, service, quality, and capability together.
- The board needs consistency: Governance benefits from a stable structure that can be reviewed quarter after quarter.
When OKRs are the better instrument
Objectives and Key Results are more effective when the company needs focus, pace, and visible alignment around a few priorities. The method is sharper, lighter, and often better suited to growth-stage businesses or transformation programmes.
An EdTech company expanding new course lines, for example, may need every team to orient around enrolment quality, learner engagement, and counselling throughput. OKRs can create that concentration faster than a broad scorecard.
OKRs tend to work best when:
- The company is changing quickly: Teams need a short-cycle method that can be reset regularly.
- A few bets dominate the period: Leadership wants to rally the business around a small number of outcomes.
- Cross-functional execution is the bottleneck: Teams need a common language for what matters now.
Reporting Framework Comparison for CXOs
| Attribute | Balanced Scorecard (BSC) | Objectives and Key Results (OKRs) |
|---|---|---|
| Strategic focus | Enterprise balance across financial, customer, process, and capability perspectives | Concentrated progress against a limited set of strategic objectives |
| Ideal implementation scenario | Established organisations managing trade-offs across business units | Growth, transformation, product expansion, or turnaround efforts |
| Reporting cadence | Often monthly or quarterly with stable executive review rhythms | Usually shorter-cycle, with frequent review and rapid adjustment |
| Primary benefits | Better governance, balanced visibility, and fewer blind spots | Stronger alignment, sharper prioritisation, and execution focus |
Boards don't have to treat this as a binary choice. Many use a Balanced Scorecard for enterprise oversight and OKRs inside business units or strategic initiatives. The mistake is not mixing them. The mistake is adopting one without deciding what decisions it is meant to support.
How to Design a High-Impact Reporting System
Most reporting systems become bloated because teams start with available data instead of strategic questions. The result is familiar: too many charts, too few decisions, and a recurring debate over what the numbers really mean.
Start with board-level questions
A strong design process begins with the decisions the board and executive team need to make. That usually means asking:
- Where are we gaining or losing value?
- Which operating signals predict that movement early?
- Who owns intervention when a metric breaks tolerance?
Those questions lead to a different metric selection process. Instead of asking what the CRM, dialler, ERP, or service desk can export, leadership asks what evidence is required to judge commercial performance, operational resilience, and customer outcome quality.
For a practical model of how teams structure visual oversight for frontline execution, call centre dashboards and KPI design is a useful reference point.
Replace vanity metrics with resolution metrics
This is the single most important shift in performance reporting for customer operations and AI-assisted workflows. Standard reports often celebrate containment rate, meaning the interaction stayed with automation and didn't transfer to a human. That sounds efficient. It isn't the same as success.
A critical flaw in standard AI reporting is conflating containment with task resolution. Reports may show 70% of calls contained, yet data shows that up to 70% of those interactions fail to resolve the user's core intent. In one IN real estate audit, 34% of AI-qualified leads were false positives, and firms relying on containment metrics alone saw a 12% drop in conversion, according to Hamming AI on voice agent evaluation metrics.
A board should read that as a warning against automation theatre. The operation appears leaner while commercial quality deteriorates.
Practical rule: Don't ask, “How much did the system handle?” Ask, “How much did the system complete correctly, without downstream rework?”
A better reporting design includes measures such as:
- End-to-end task resolution: Did the user's need get completed, not merely routed?
- Resolution confidence: How certain is the organisation that the recorded success was genuine?
- Re-handoff tracking: Did the customer come back or require human recovery soon after?
- Commercial quality: Did the lead, ticket, or case move to the next valuable stage?
This changes behaviour. Operations teams stop optimising for superficial automation volume. Sales teams stop celebrating low-value lead qualification. Service teams stop accepting contained but unresolved interactions as evidence of improvement.
Build cadence and ownership into the system
A metric without ownership becomes an observation. A metric with ownership becomes a management tool.
High-impact performance reporting usually works across three cadences:
- Daily operational views: Used by team leads to catch immediate drift.
- Weekly management reviews: Focused on root causes, corrective actions, and cross-functional blockers.
- Monthly executive reporting: Limited to trends, risks, and decisions requiring resource or policy change.
The reporting architecture should also distinguish between leading indicators and lagging outcomes. A falling resolution rate may precede lower conversion. A rise in repeat contacts may foreshadow higher cost-to-serve. The board needs both, but not mixed together in a way that obscures causality.
When leaders design reports around outcome quality and intervention rights, performance reporting stops being a documentation exercise and starts becoming an operating discipline.
Performance Reporting Across Key Industries
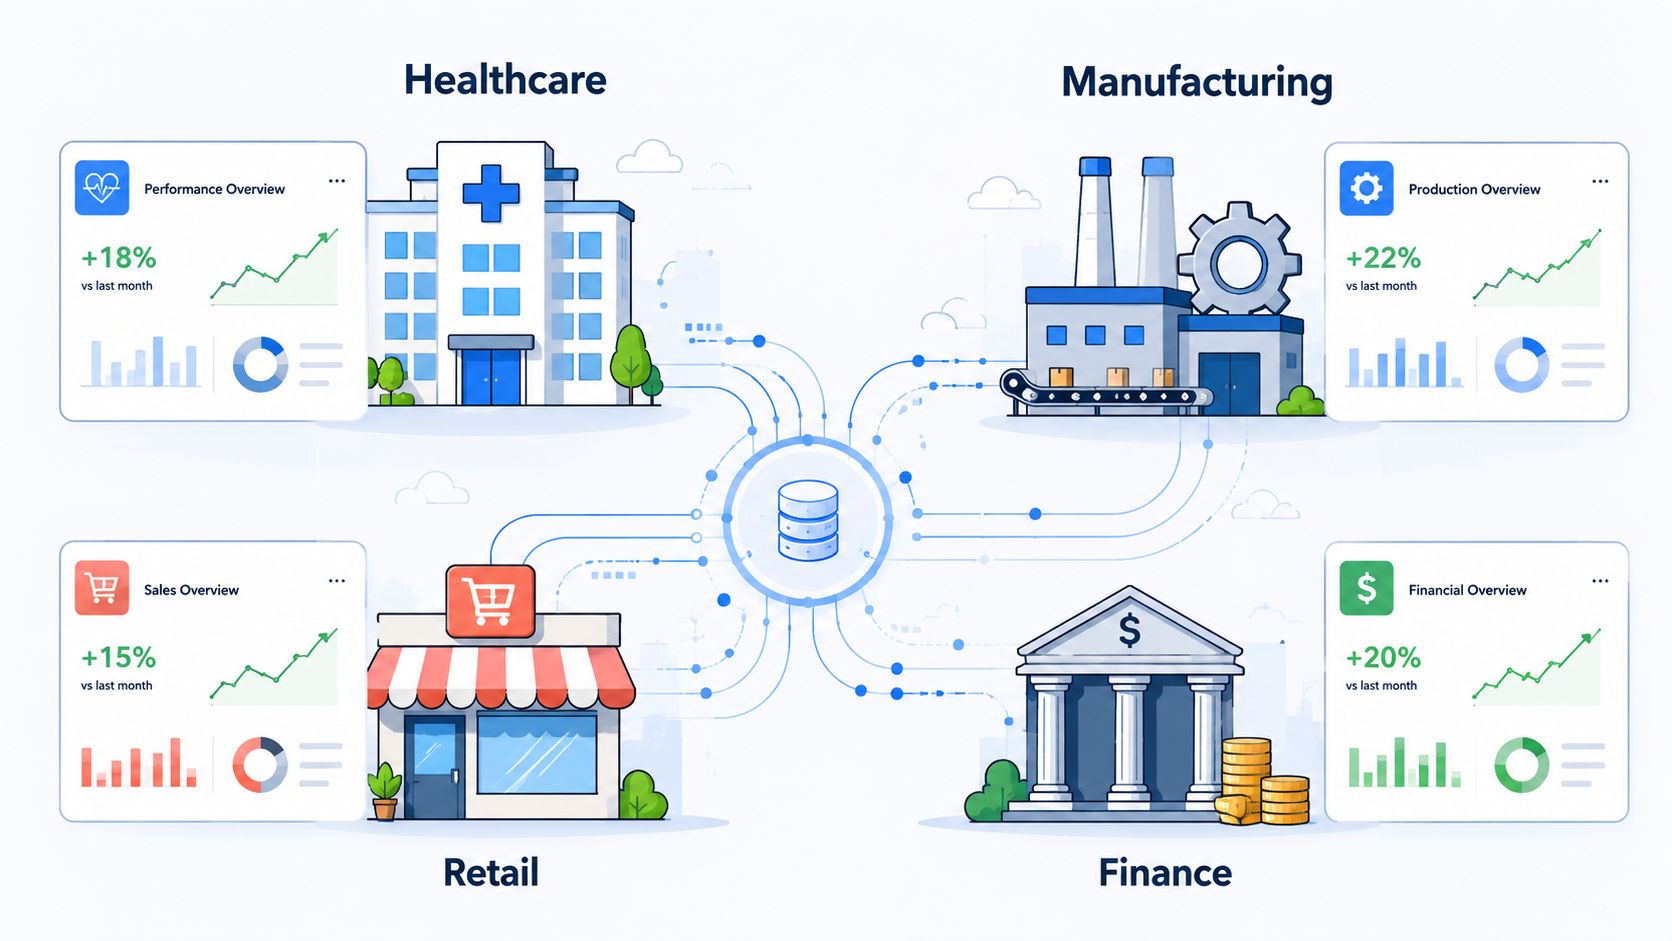
Sector context changes what “good” looks like. That's why generic dashboards often fail senior leaders. They flatten industry economics into the same set of broad service metrics and miss the few signals that determine commercial performance.
BFSI and EdTech
In BFSI, reporting should tell executives whether customer interactions are moving regulated processes forward with acceptable quality. A dashboard that shows call volume or average handling alone won't tell a director whether KYC guidance was accurate, whether a transfer happened because of policy complexity, or whether customers abandoned the process at the verification stage.
In EdTech, the equivalent mistake is treating enrolment as the commercial endpoint. Boards need to see whether qualified prospects attend counselling, whether counselling leads to fit-for-programme enrolment, and whether engagement patterns after sign-up suggest retention risk. Reporting should connect admissions activity to student quality and downstream completion potential.
The most striking data point here is accuracy. In sectors like BFSI and EdTech, the benchmark for AI qualification matching human judgement is 97%. Reaching that threshold directly lifted lead-to-booking conversion from 2% to over 8%, according to Indeed's performance reporting example on qualification accuracy. That is the strategic link many reports miss. Precision in reporting inputs changes top-line outcomes.
High-fidelity reporting doesn't just improve oversight. It improves the underlying economics of conversion.
Real estate, e-commerce, and healthcare
In real estate, the most useful reports usually centre on lead quality by source, site-visit booking success, and the rate at which qualification data holds up once a sales consultant engages. If booking rates look weak, the problem may not be agent effort. It may be poor qualification logic upstream.
In e-commerce, performance reporting should go beyond orders and include reasons for cart abandonment, unresolved support contacts before purchase, and which service interactions preserve customer lifetime value rather than merely close tickets. The board's interest is not only revenue capture, but how service quality protects future revenue.
In healthcare, the reporting lens shifts again. Appointment booking efficiency matters, but patient no-show patterns, rebooking friction, and escalation reasons often matter more. A clinic can automate intake and still produce weak outcomes if the reporting system doesn't show whether patients completed the booking journey with confidence.
Across all five sectors, the common lesson is that the most important metric is rarely the most visible one. Directors should insist on sector-specific outcome chains, not one-size-fits-all activity reporting.
Automating Data Capture with Voice AI
Phone calls still sit outside the reporting discipline applied to web, product, and finance data. That gap matters because a large share of buying, booking, qualification, and support decisions still happens in conversation, where manual notes capture only a fraction of what occurred and often miss the reason an interaction succeeded or failed.
Why voice interactions change the reporting model
A well-designed Voice AI stack converts each call into structured event data: detected intent, authentication outcome, routing path, interruption points, escalation triggers, handling time, and final resolution state. That changes reporting quality at the source. Leaders no longer depend on fragmented summaries written after the interaction. They can inspect what happened inside the interaction and tie it to conversion, retention, and cost.
The strategic gain is not higher data volume alone. It is better observability into the moments where revenue is won or lost.
That is the basis of Resolution-Aware Reporting. Instead of counting how many calls were automated, it asks whether the customer's issue was resolved, whether the next commercial step happened, and which failure mode blocked the outcome. In practice, that means correlating operational signals such as latency spikes, fallback frequency, transfer reasons, and repeat contacts with business results such as booked appointments, qualified pipeline, recovered carts, or reduced support cost per case.
One useful technical reference for teams assessing implementation options is Voice AI agents for developers, particularly where reporting must connect conversation data to CRM records, workflow systems, and internal analytics layers.
What CXOs should insist on seeing
Board reporting on voice automation should start with outcome integrity. Call volume, containment rate, and average handle time have some operational value, but they do not show whether the system resolved customer needs or processed interactions faster. A stronger reporting layer tracks resolution rate, intent recognition quality, transfer rate by failure cause, repeat-contact incidence, and abandonment by journey stage.
Retell AI's guidance on voice agent customer service metrics highlights intent accuracy, resolution, and handoff behaviour as core measures of production performance. Microsoft's guidance on AI agent performance measurement points in the same direction. The common implication is clear. Executive reporting should treat automation as a service delivery system, not a volume-processing tool.
Latency deserves separate board attention because averages hide the failure pattern. Telnyx's analysis of voice AI latency explains how response delays degrade conversational flow as pauses become noticeable and interactions start to feel unnatural. For reporting design, the implication is practical: measure latency by percentile, isolate spikes by provider or workflow step, and compare those spikes with abandonment, transfer, and failed-resolution rates. That is how teams identify whether an infrastructure issue is suppressing revenue conversion or increasing avoidable contact volume.
This is also where finance and operations align. If a voice system appears efficient on average but generates more retries, transfers, or abandoned calls at specific latency thresholds, the organisation absorbs hidden cost in agent workload, lower conversion yield, and weaker customer retention. Leaders trying to turn data into profit need reporting that surfaces those trade-offs early.
A short demonstration helps clarify what this looks like in practice:
The board-level conclusion is straightforward. Voice AI should be evaluated as a structured data capture layer for customer operations. Its value increases sharply when reporting shows which conversations reached resolution, which failed, why they failed, and what each failure pattern costs the business.
Turning Data into Your Decisive Advantage
Boards rarely suffer from a lack of data. They suffer from weak translation between data and action. That is why performance reporting deserves more scrutiny than it usually receives.
The strongest systems do three things well. They measure resolution rather than activity, they expose the operational causes of commercial outcomes, and they give named leaders the information required to intervene in time. For directors, that creates a direct line from customer interaction quality to revenue protection, cost discipline, and execution confidence.
For leaders thinking about how to turn data into profit, the key question isn't whether reporting exists. It's whether the reporting changes decisions before value is lost.
A reporting system should function like a trusted adviser. It should show what is working, where the operating model is breaking, and which lever will produce the fastest practical improvement.
DialNexa Labs Private Limited helps organisations build that foundation by capturing structured voice interaction data that can feed resolution-aware performance reporting across qualification, support, presales, and booking workflows. If your board wants reporting that reflects real customer outcomes rather than surface activity, explore how DialNexa Labs Private Limited fits into your reporting architecture.

Leave a Reply