
The state of AI voice calling in India: We analysed 1M AI-assisted business calls
AI voice agents are becoming a core part of how businesses in India qualify leads, handle inbound enquiries, confirm event attendance, and scale customer conversations. But despite the rapid adoption of Voice AI, there’s still very little publicly available data on what actually makes AI-assisted phone calls successful.
To better understand what drives real-world performance, DialNexa analysed more than one million AI-assisted business calls made and received by businesses across India. The dataset includes both inbound and outbound conversations handled by AI voice agents across multiple industries and use cases.
Instead of evaluating AI voice in a controlled environment or product demo, this report looks at how AI performs in production, where factors like pickup rates, response latency, language switching, retry strategies, and conversation design directly influence business outcomes.
Our goal was simple:
Identify what actually works across one million real conversations, not what should work in theory.
Executive Summary
After analyzing more than one million AI-assisted business calls, several patterns became clear.
Brand-new calling numbers achieved an average 48% first-attempt pickup rate, but that performance declined over time as number reputation changed. Campaigns that implemented structured retry sequences increased cumulative pickup rates to more than 70%.
Customers were also far more willing to engage with AI than many businesses expect. Less than 3% of all conversations ended because the customer hung up first, indicating that conversation design plays a much larger role than simply sounding human.
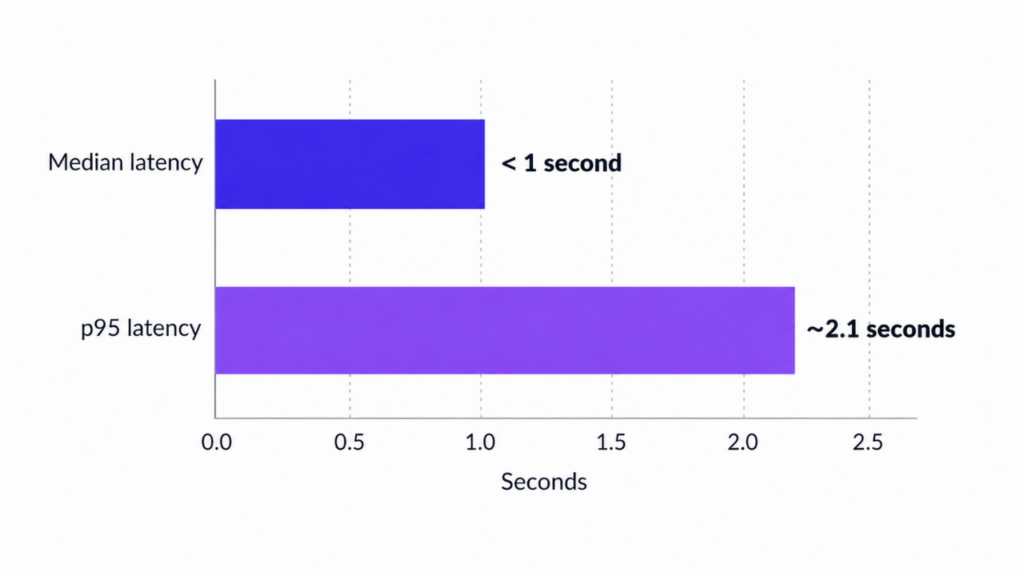
Response speed proved equally important. Median response latency remained under one second, while slower responses around the 95th percentile (approximately 2.1 seconds) were often enough to disrupt the natural flow of conversation.
The report also found that multilingual conversations are the norm rather than the exception in India. Customers frequently switched between Hindi and English within the same sentence, making code-switching support an essential capability for AI voice systems.
Across all use cases, one theme emerged consistently:
Voice quality helps an AI agent get someone to answer the phone. Everything that follows depends on timing, retries, latency, language handling, and conversation design.
What You’ll Find in This Report
This report covers nine key findings from one million AI-assisted business calls:
- Why some AI conversations last over 20 minutes while most finish in under two?
- How phone number reputation affects pickup rates and why retries matter?
- Why customers rarely hang up on AI once a conversation begins?
- The impact of response latency on customer trust?
- Why Hinglish is a more important benchmark than English alone?
- Which AI calling use cases consistently perform best?
- Which industries are adopting AI voice the fastest?
- How inbound and outbound AI calls differ?
- The three calling windows that consistently produce the highest connectivity?
Whether you’re evaluating AI voice for sales, customer support, marketing, or contact center operations, these findings provide practical benchmarks drawn from real production conversations rather than theoretical models.
Key Statistics at a Glance
Before diving into the detailed findings, here are the headline numbers from our analysis of more than one million AI-assisted business calls made and received by businesses across India.
| Metric | Result |
|---|---|
| Total AI-assisted calls analysed | 1,000,000+ |
| First-attempt pickup rate | 48% |
| Cumulative pickup rate with retries | 70%+ |
| Median AI response latency | <1 second |
| 95th percentile (P95) response latency | 2.1 seconds |
| User-initiated drop-off rate | <3% |
| Inbound call goal completion | 89% |
| Calls lasting longer than 20 minutes | 120+ |
| Share of inbound call volume | 16% |
Best Calling Windows
The analysis also identified three daily time windows that consistently produced the highest connectivity for campaigns targeting working professionals.
| Rank | Time Window | Why It Works |
|---|---|---|
| 1 | 10:00 AM – 12:00 PM | Between the first round of meetings and lunch |
| 2 | 4:00 PM – 6:00 PM | The workday is winding down before the evening commute |
| 3 | 8:00 PM – 9:00 PM | After dinner, when people are more likely to check their phones |
Two metrics deserve particular attention.
The 48% first-attempt pickup rate represents what a brand-new outbound calling number can achieve before number reputation begins to decline.
The 70%+ cumulative pickup rate reflects the percentage of leads reached after structured retry sequences are completed.
The difference between these two numbers is significant because it demonstrates that campaign performance depends not only on the first call, but also on how intelligently follow-up attempts are managed.
These headline metrics provide context for the nine findings discussed throughout this report. Each finding explores the factors that influence AI voice performance, from conversation design and response latency to language handling, retry strategies, and call timing.
Methodology
Every insight in this report comes from more than one million AI-assisted business calls handled through the DialNexa platform on behalf of businesses operating across India.
Rather than relying on simulated conversations or controlled product demonstrations, this analysis is based entirely on live production traffic. Every call included in the dataset was placed or answered by a DialNexa AI voice agent for paying customers, providing a realistic picture of how AI performs in day-to-day business operations.
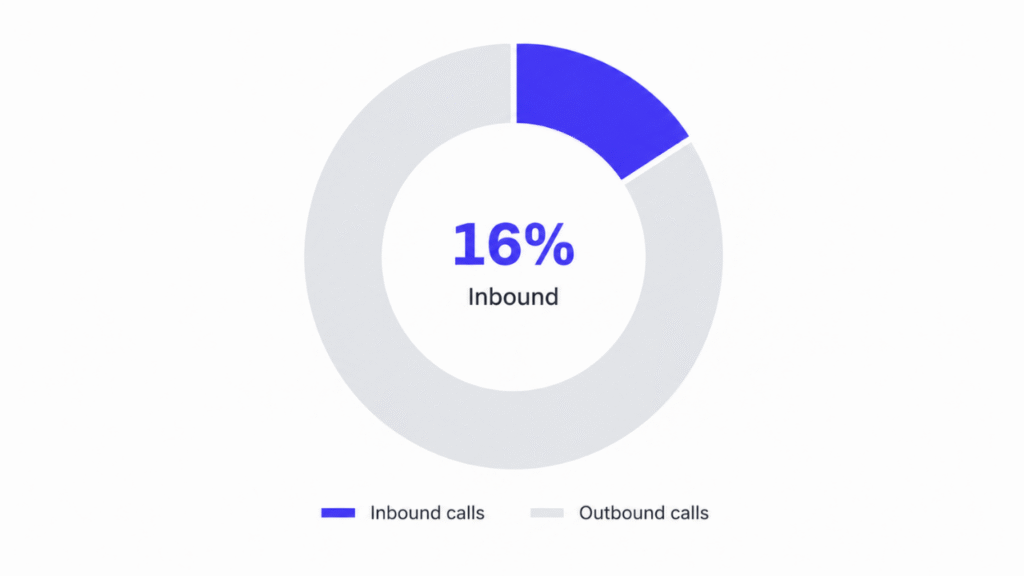
The dataset covers both outbound and inbound calls, with outbound conversations accounting for approximately 84% of total call volume and inbound conversations making up the remaining 16%.
Dataset Overview
| Attribute | Details |
|---|---|
| Total call volume | 1,000,000+ AI-assisted business calls |
| Call direction | ~84% Outbound, ~16% Inbound |
| Geography | Businesses operating across India |
| Voice engine | ElevenLabs |
| Languages observed | English, Hindi, and Hinglish (mixed-language conversations) |
| Primary use cases | Pre-sales lead qualification, webinar and event attendance |
| Leading industries | Education Technology (EdTech) and Banking, Financial Services & Insurance (BFSI) |
Key Metrics Used Throughout This Report
To ensure consistency across all findings, the following metrics are used throughout this report.
| Metric | Definition |
|---|---|
| Pickup Rate | The percentage of dialed calls where the recipient answered the call. |
| Cumulative Connectivity | The total percentage of leads successfully reached after all retry attempts, rather than only the first call. |
| Goal Completion | The percentage of conversations that achieved their intended objective. |
| User-Initiated Drop-off | The percentage of calls that ended because the customer hung up first. |
| Median Response Latency | The midpoint response time across all conversations, where half of responses were faster and half were slower. |
| 95th Percentile (P95) Latency | The response time below which 95% of all AI responses occurred, used to measure the slowest normal conversations. |
Data Source
Every statistic presented in this report comes from live customer conversations handled by DialNexa’s AI voice agents.
This report does not use synthetic datasets, laboratory testing, or staged product demonstrations. Instead, it reflects how AI voice agents performed while supporting real businesses and real customers across production environments.
Because the data comes from active customer deployments, the mix of industries, use cases, and conversation types reflects actual customer usage during the reporting period rather than a deliberately balanced research sample.
Limitations of the Dataset
As with any production dataset, there are limitations that should be considered when interpreting the findings.
- The report does not include the exact date range covered by the analysis or the total number of businesses represented in the dataset.
- Performance breakdowns by individual industries, languages, or Indian states were not available beyond the aggregate insights presented in this report.
- Regional comparisons, such as metro versus Tier-2 cities or North versus South India, are outside the scope of the available data.
- Individual call-level distributions, including complete duration or latency histograms, were not available. Findings are therefore based on aggregate metrics such as medians, percentiles, and category averages.
- This report analyzes performance exclusively on the DialNexa platform. It is not intended as a controlled comparison with human agents or competing Voice AI providers.
Where detailed breakdowns were unavailable, this report reports only what the underlying data supports and avoids making assumptions beyond the dataset.
Findings
Each finding below is drawn from a specific slice of the dataset, with what it means for teams putting these results to use.
Finding 1: 120+ AI Calls Lasted More Than 20 Minutes
One of the first questions businesses ask when evaluating AI voice agents is, “How long can an AI realistically hold a conversation?”
The data suggests there isn’t a single answer.
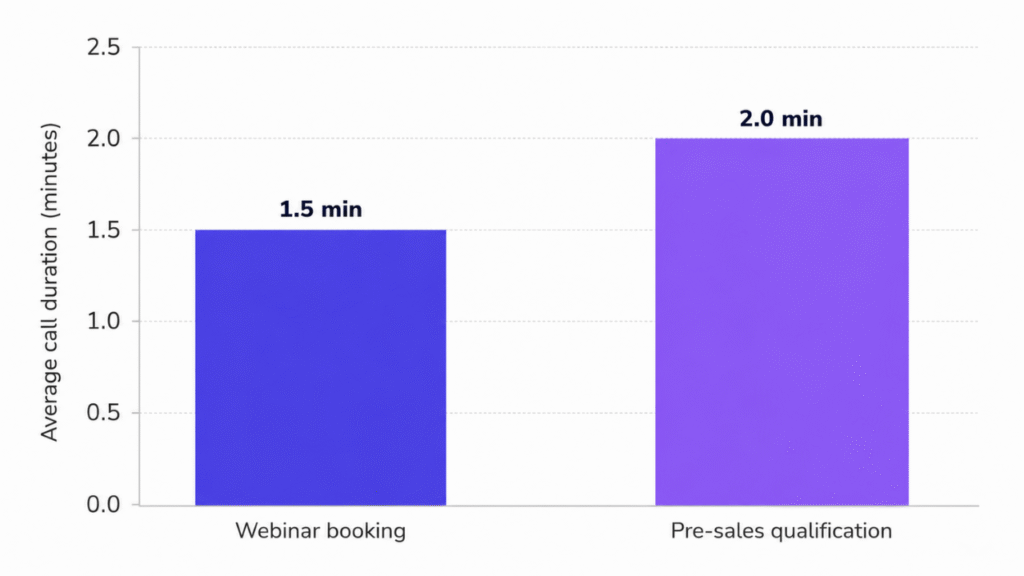
Most AI-assisted business calls in our dataset were relatively short. Webinar reminder and attendance confirmation calls typically lasted around 90 seconds, while pre-sales lead qualification conversations averaged close to two minutes. These are structured interactions designed to achieve one specific objective quickly and efficiently.
However, the most interesting insight came from the other end of the distribution.
Across more than one million AI-assisted business calls, over 120 conversations lasted longer than 20 minutes.
These weren’t cases where the AI became stuck in a loop or failed to complete the interaction. They were successful conversations where customers remained engaged because the discussion required more time.
This finding challenges a common misconception that AI voice agents are only suitable for short, scripted conversations. When the conversation is designed around a meaningful objective, AI can successfully manage discussions that would traditionally require a human representative.
Rather than measuring success by keeping conversations short, businesses should focus on whether the conversation achieves its intended outcome.
Why This Matters
Conversation length should be determined by the objective, not by assumptions about what AI can or cannot handle.
Reminder calls, appointment confirmations, and basic notifications naturally benefit from brief interactions. Qualification calls, product discovery, and consultative conversations often require additional time to understand customer needs and gather meaningful information.
Longer conversations are not necessarily inefficient. In many cases, they indicate stronger customer engagement.
Practical Takeaways
- Don’t assume every AI-assisted call needs to follow a tightly scripted format.
- Match expected call duration to the complexity of the use case rather than imposing a fixed time limit.
- Monitor unusually long conversations to determine whether they represent genuine engagement or areas for improvement.
- Measure success using business outcomes instead of average call duration alone.
When an AI voice agent can successfully manage longer, meaningful conversations, it allows businesses to automate interactions that would otherwise require additional human capacity, without compromising customer engagement.
| BUSINESS IMPACT: Longer, well-designed calls can replace conversations a human rep would otherwise have to take, without adding headcount. |
Finding 2: Why AI Call Pickup Rates Drop After the First 1,000 Leads
One of the clearest patterns in the data was the impact of phone number reputation on pickup rates.
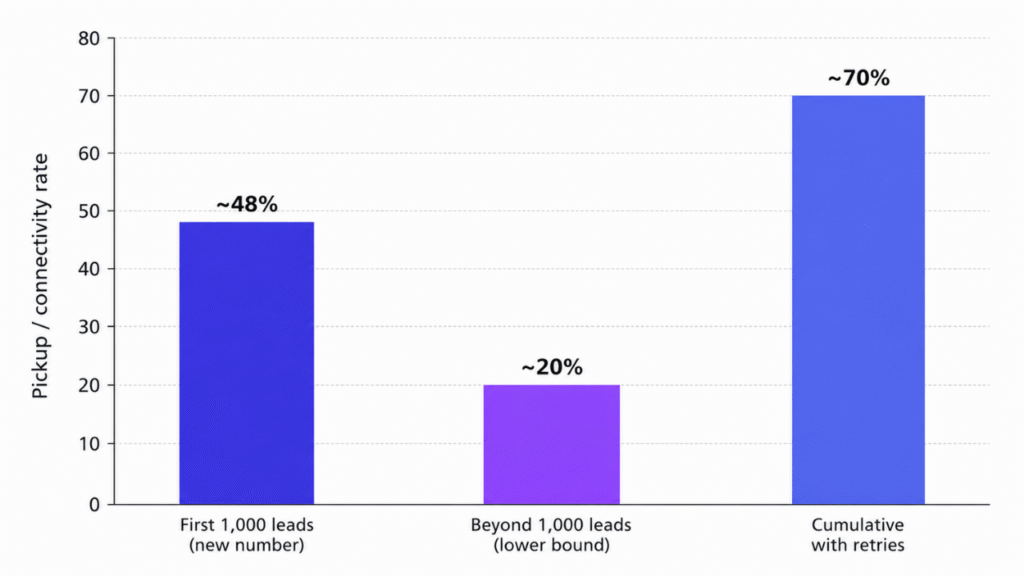
Across more than one million AI-assisted business calls, brand-new calling numbers achieved a pickup rate of close to 48% across their first 1,000 leads.
As the same numbers were used for more calls, pickup rates started to decline. For some call categories, they fell as low as 20%. Recipients may start recognizing the number, and carriers may also begin flagging it after repeated outbound activity.
Retries helped recover a significant share of these missed connections.
When leads opted into automated retry sequences and calls were made at appropriate intervals, some campaigns achieved cumulative connectivity of more than 70%.
This means a low pickup rate on an individual attempt does not necessarily indicate poor campaign performance. The full retry cycle provides a more useful measure of how many leads the campaign actually reaches.
Why This Matters
A calling number can perform very differently as call volume increases. Looking only at the initial pickup rate can therefore give teams an incomplete view of campaign performance.
Number reputation and retry strategy should be monitored throughout an outbound campaign. Teams can track when pickup rates begin to decline, rotate numbers when necessary, and schedule additional attempts for leads who did not answer the first time.
The difference between a 48% initial pickup rate and 70%+ cumulative connectivity also shows how much additional reach can come from retrying unanswered leads.
Practical Takeaways
- Monitor pickup rates as calling volume increases.
- Rotate numbers before pickup rates decline significantly.
- Include retry logic when setting up outbound campaigns.
- Schedule retries at different intervals rather than repeatedly calling at the same time.
- Measure cumulative connectivity after the full retry cycle.
- Avoid evaluating a campaign using first-attempt pickup rates alone.
For outbound AI calling, the phone number and retry schedule can have a direct impact on how many leads are ultimately reached. Tracking both gives teams a clearer picture of campaign performance.
| BUSINESS IMPACT: A pickup rate that looks weak on day one, judged fairly across the full retry cycle, directly changes cost per connected lead. |
Finding 3: Less Than 3% of Users Hung Up First
A common concern with AI voice agents is whether people will stay on the call once they realize they are speaking with AI.
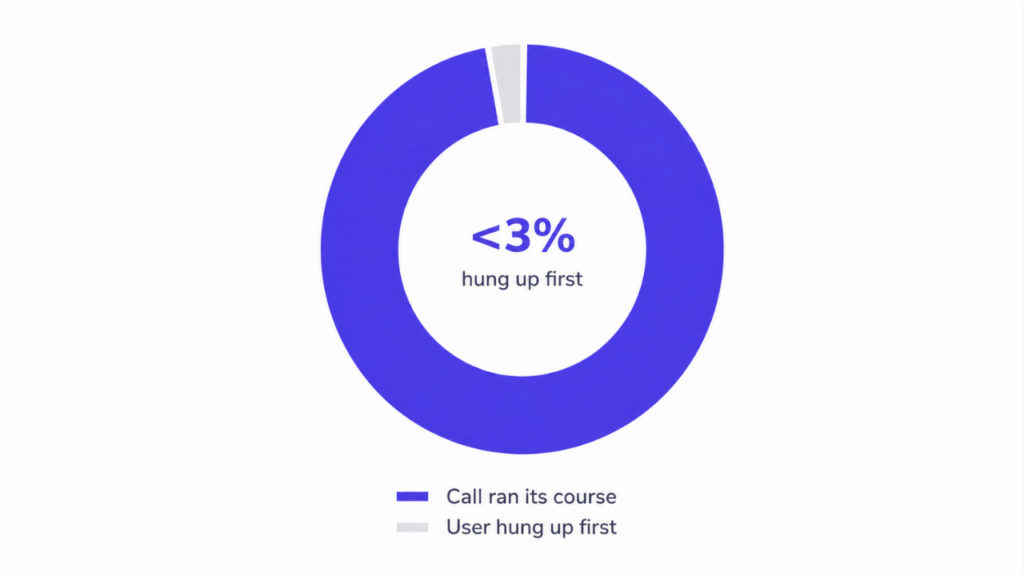
Across the dataset, less than 3% of all calls ended because the user hung up first.
Several factors influenced how long people stayed on the call. Natural-sounding voices performed better than robotic defaults, and conversational opening lines helped reduce early drop-offs. Stiff or heavily scripted introductions were more likely to make the interaction feel automated.
Transparency also mattered. When users directly asked whether they were speaking with an AI, confirming it helped build trust. Trying to avoid the question had the opposite effect.
The first 30 seconds were particularly important. Voice quality helped establish the interaction, while the opening line, response speed, tone, and conversation flow influenced whether the person continued.
There were still avoidable reasons for users to disconnect. A slow response, an inappropriate question at the wrong moment, or a script that started repeating itself could quickly cause someone to end the call.
Why This Matters
A user-initiated drop-off rate below 3% across more than one million calls suggests that people are willing to continue conversations with AI voice agents when the experience feels natural and responsive.
Teams should pay particular attention to the beginning of the call. An awkward introduction or scripted opening can affect the conversation before the AI has a chance to complete its objective.
Transparency should also be part of the conversation design. If someone asks whether they are speaking with an AI, the agent should answer clearly.
Practical Takeaways
- Use natural-sounding voices instead of robotic defaults.
- Review the first 30 seconds of calls when investigating early drop-offs.
- Avoid stiff, overly scripted opening lines.
- Clearly confirm that the caller is an AI when someone asks.
- Monitor slow responses, repeated questions, and other conversation issues that can cause users to disconnect.
- Track user-initiated drop-off as a core call performance metric.
Every user who hangs up represents a conversation that connected but did not reach its intended outcome. Keeping that rate below 3% helps businesses get more value from the calls they are already making.
| BUSINESS IMPACT: Every percentage point of drop-off is a conversation that started and produced nothing. Keeping that number low protects the return on every dialed call. |
Finding 4: Median AI Response Time Stayed Under One Second
Response speed had a direct impact on how natural AI-assisted calls felt.
Across more than one million calls, median response latency stayed under one second. This means half of all responses were delivered faster than one second.
At the slower end, P95 response latency was around 2.1 seconds. P95 represents the response time below which 95% of responses occurred and helps identify the slower interactions that users are more likely to notice.
A two-second delay may seem small, but during a phone conversation it can create an awkward pause. Even when most of the interaction is fast, a few noticeably slow responses can interrupt the flow of the conversation and affect user engagement.
Several factors contributed to latency spikes in the dataset:
| Cause | What Happens |
|---|---|
| Uncommon phrasing | The model may not have a cached response available. |
| Network hops | Additional round trips between speech and language layers increase response time. |
| Peak concurrency | A large number of simultaneous calls compete for the same compute resources. |
DialNexa uses several techniques to keep response times low. Speech recognition and the language model can run in parallel, common phrases can be cached instead of generated repeatedly, and the system can begin predicting a likely response before the user has completely finished speaking.
Why This Matters
Average or median latency alone does not show the complete customer experience.
A system may respond quickly most of the time while still producing occasional delays that affect conversations. Tracking P95 latency alongside median latency makes these slower responses easier to identify.
For AI voice agents, latency is something callers experience directly. Long pauses can make conversations feel less natural and can contribute to users ending calls before the intended objective is completed.
Practical Takeaways
- Track P95 latency alongside median response time.
- Investigate latency spikes during periods of high call volume.
- Cache frequently used responses where appropriate.
- Reduce unnecessary network hops between speech and language systems.
- Monitor whether slower responses are associated with early call endings.
- Treat response latency as part of the overall call experience.
Across the dataset, keeping median latency below one second helped conversations maintain a natural pace. The 2.1-second P95 latency also shows why teams need to monitor slower responses, even when overall performance appears fast.
| BUSINESS IMPACT: Latency that creeps past the median is often the difference between a call that converts and one that gets cut short before the pitch even lands. |
Finding 5: Hinglish Is a Core Requirement for Voice AI in India
Indian conversations frequently move between languages within the same sentence. A person may begin speaking in Hindi, switch to English for a product or pricing question, and move back to Hindi without consciously making the switch.
Across the calls analysed, English, Hindi, and Hinglish were the most-used languages and also showed the most consistent performance.
This makes code-switching an important part of evaluating Voice AI for the Indian market. Testing a system only on conversations conducted entirely in English or Hindi does not reflect how many people actually speak.
The data also showed differences between the technologies used to process these conversations.
Speech-to-Speech Models
Speech-to-speech models handled mid-sentence Hindi and English switches directly. Since the conversation did not need to pass through a separate translation step, there were fewer opportunities for meaning or context to be lost between different stages.
These models showed:
- Better handling of mid-sentence Hindi and English switches
- Fewer losses between different processing stages
- More consistent performance during mixed-language conversations
Cascade Pipelines
Cascade pipelines first convert speech into text and then generate and convert the response back into speech.
Some language combinations worked reliably with this approach. Others showed issues with transcription accuracy, pronunciation, and context retention.
A model that performs well when tested separately in English and Hindi may therefore perform differently when both languages appear within the same conversation.
For example, a real conversation may sound more like:
Caller: “Haan bhaiya, but what’s the pricing after the free trial?”
This type of language switching is common in India and needs to be included when testing the performance of a Voice AI system. In these cases, Dialnexa’s Voice AI agents were able to switch effortlessly, replying with:
Agent: “Sure, so after the trial it’s nine ninety nine a month, koi extra charge nahi hai.”
Speech-to-Speech vs. Cascade Pipelines
| Speech-to-Speech Models | Cascade Pipelines |
|---|---|
| Handles mid-sentence Hindi/English shifts natively | Some language pairs performed reliably |
| No hand-off losses between pipeline stages | Others saw transcription or pronunciation drift |
| More consistent results in mixed conversations | Context could get lost between stages |
Why This Matters
Language support should be evaluated based on real conversations rather than the number of languages listed as supported.
A platform may support both Hindi and English while still struggling when a caller switches between them mid-sentence. Pronunciation, transcription, and context can all be affected during these transitions.
The same applies to other Indian language combinations. Performance with one language pair does not guarantee the same results with another.
Practical Takeaways
- Include code-switching when testing Voice AI for Indian users.
- Test mixed Hindi and English conversations separately from Hindi-only and English-only calls.
- Evaluate individual language pairs instead of relying on a general multilingual capability claim.
- Compare speech-to-speech and cascade approaches for the languages your customers actually use.
- Check pronunciation, transcription accuracy, and context retention during mixed-language conversations.
- Test each Indian language individually before deploying it at scale.
For businesses operating in India, Hinglish should be treated as a standard testing scenario. A Voice AI system needs to handle the way customers naturally speak, including frequent language switching within the same conversation.
| BUSINESS IMPACT: Getting code-switching wrong doesn’t just sound bad. It silently excludes a large share of Indian callers from a conversation that could have worked. |
Finding 6: Pre-Sales Lead Qualification Was the Top-Performing Use Case
Across the 1 Million AI assisted calls analysed, pre-sales lead qualification was the largest and most successful use case.
The AI agents contacted leads, asked qualification questions, identified their requirements, and flagged the leads that were ready for a conversation with the sales team.
Webinar and event attendance was the second strongest use case.
AI agents were used to confirm interest, send reminders, answer basic questions, and encourage registered participants to attend.
These two use cases shared several characteristics. The conversations had a specific goal, followed a structured flow, and produced an outcome that was easy to measure.
For lead qualification, the objective could be determining whether a prospect was sales-ready. For an event campaign, it could be confirming whether a registered participant planned to attend.
Open-ended sales and support conversations also appeared in the dataset, but their performance was less consistent. These conversations require more careful design because there are more directions the interaction can take.
Top AI Voice Use Cases in the Dataset
| Rank | Use Case | What the AI Did |
|---|---|---|
| 1 | Pre-sales lead qualification | Contacted leads, captured intent, asked qualification questions, and identified sales-ready prospects |
| 2 | Webinar and event attendance | Confirmed interest, provided reminders, answered basic questions, and supported event attendance |
Why Structured Calls Performed Well
Both leading use cases gave the AI a clearly defined objective.
A qualification call can be designed around questions such as what the prospect needs, why they are currently evaluating a solution, and whether they are ready to speak with sales.
An event attendance call can focus on whether the person still plans to attend and whether they need any additional information beforehand.
This structure also makes performance easier to measure. Teams can track whether the lead qualified, whether an appointment was scheduled, or whether an attendee confirmed their participation.
A TYPICAL QUALIFICATION CALL
Agent: “Hi, this is calling from [Company]. You downloaded our pricing guide last week, do you have two minutes?”
Agent: “What’s driving the search right now, is it cost, or something your current setup can’t do?”
Agent: “Got it. I’ll pass this to a specialist who can walk you through pricing. Does tomorrow afternoon work?”
Practical Takeaways
- Start with use cases that have a clearly defined outcome.
- Pre-sales lead qualification is a strong starting point for sales teams evaluating AI voice.
- Webinar and event attendance calls are another proven use case from the dataset.
- Define what a successful call looks like before building the conversation.
- Use structured questions when the AI needs to collect specific information.
- Test more open-ended conversations after structured use cases are performing reliably.
For businesses introducing AI calling, starting with a structured use case can make it easier to measure performance and identify where the system needs improvement before expanding it to more complex conversations.
| BUSINESS IMPACT: Picking the right first use case shortens the path from pilot to measurable return, and builds internal confidence to expand further. |
Finding 7: EdTech and BFSI Led AI Voice Adoption
Education Technology (EdTech) and Banking, Financial Services and Insurance (BFSI) were the two leading sectors for AI voice adoption in the dataset.
While the industries are very different, they face a similar problem: high volumes of leads and customer interactions that require fast follow-up.
For an EdTech company, a single marketing campaign can generate thousands of enquiries within a short period. Sales teams need to contact, qualify, and follow up with those prospects while their interest is still high.
BFSI companies face similar volume challenges across lead follow-ups, reminders, and collections. Reaching every customer manually and at the right time becomes difficult as call volumes increase.
In both sectors, AI voice agents helped handle the gap between the number of people who needed to be contacted and the number a human team could realistically reach in time.
Why EdTech and BFSI Are Adopting AI Voice
| Industry | Where AI Voice Helps |
|---|---|
| Education Technology | Managing high lead volumes that sales teams cannot qualify or follow up with quickly enough |
| BFSI | Handling follow-ups, reminders, and collections calls at volumes that manual teams may struggle to sustain |
The same pattern can apply to other industries with sudden or consistently high call volumes.
A real estate company may receive a surge of enquiries following a new property launch. An insurance provider may see call volumes increase around renewal periods. Healthcare businesses may receive large numbers of enquiries following a campaign.
In each case, the challenge is similar: lead or customer volume grows faster than the team’s ability to make timely calls.
Signs That Call Volume Is Outpacing Team Capacity
Businesses may benefit from additional AI voice coverage when:
- Average response time to a new lead is measured in hours rather than minutes.
- Leads regularly go cold before a sales representative can call them.
- Call volumes fluctuate significantly throughout the month or year.
- Hiring enough representatives to cover peak periods is difficult.
- Existing teams spend a large amount of time on repetitive follow-ups and reminders.
Practical Takeaways
- Compare lead volume with the number of leads your team can realistically contact.
- Identify periods where leads are waiting too long for a response.
- Use AI voice agents to cover high-volume and time-sensitive conversations.
- Prioritize workflows such as qualification, follow-ups, reminders, and collections where call volumes are predictable.
- Set up additional calling capacity before lead backlogs become difficult to manage.
The adoption pattern across EdTech and BFSI suggests that AI voice is particularly useful when businesses need to contact more people than their existing teams can reach within the required timeframe.
| BUSINESS IMPACT: Matching AI coverage to lead-volume pressure turns a bottleneck that was costing deals into one that no longer limits growth. |
Finding 8: Inbound AI Calls Achieved an 89% Goal Completion Rate
Inbound calls represented approximately 16% of the total call volume analysed, but their performance was significantly different from outbound calls.
Across the dataset, inbound AI-assisted calls recorded an average conversation length of 13 minutes and achieved an 89% goal completion rate.
User-initiated disconnects were also extremely low. Only 0.01% of inbound calls ended because the caller hung up first.
Inbound AI Call Performance
| Metric | Result |
|---|---|
| Share of total call volume | ~16% |
| Average call length | 13 minutes |
| Goal completion rate | ~89% |
| User-initiated disconnect rate | 0.01% |
One reason for this performance is the level of intent behind an inbound call.
When someone calls a business directly, they have already decided to initiate a conversation. The AI agent does not need to convince them to answer the phone. Its role is to respond quickly, understand what the caller needs, and help them complete the intended action.
AI voice agents can also answer these calls outside regular working hours and handle multiple conversations at the same time. This gives businesses additional coverage during evenings, weekends, lunch hours, and periods of unusually high call volume.
Outbound calling serves a different purpose. It allows businesses to reach prospects or customers who have not initiated the conversation themselves. Because the starting level of intent is different, inbound and outbound calls should be evaluated separately.
Why This Matters
Combining inbound and outbound performance into a single metric can make it difficult to understand how well each type of AI call is actually performing.
An 89% goal completion rate for inbound calls may raise the overall campaign average even when outbound calls are performing differently.
Teams should therefore create separate benchmarks for each call direction and evaluate them according to their individual objectives.
For businesses testing AI voice for the first time, inbound calls can also provide a useful starting point. The caller already has an identified need, which gives the AI a clearer context for the conversation.
Practical Takeaways
- Measure inbound and outbound AI calls separately.
- Track goal completion specifically for inbound conversations.
- Consider inbound calls as an initial use case when introducing AI voice.
- Use AI to provide inbound coverage outside normal business hours.
- Prepare for periods where several inbound calls may arrive at the same time.
- Review conversation length alongside goal completion rather than treating longer calls as a negative metric.
With an 89% goal completion rate, 13-minute average call duration, and just 0.01% user-initiated disconnect rate, inbound calling was one of the strongest-performing areas in the dataset.
| BUSINESS IMPACT: Treating inbound and outbound as separate motions, with separate staffing and separate targets, prevents a strong inbound number from masking a weak outbound one. |
Finding 9: Three Calling Windows Generated Most of the Connectivity
Call connectivity was not distributed evenly throughout the day.
For campaigns targeting working professionals in India, the data showed that three specific calling windows accounted for most of the connectivity:
| Rank | Calling Window | Why It Tends to Work |
|---|---|---|
| 1 | 10 AM to 12 PM | Between the first round of meetings and lunch |
| 2 | 4 PM to 6 PM | As the workday winds down and before the evening commute |
| 3 | 8 PM to 9 PM | After dinner, when people are more likely to check their phones |
Outside these windows, pickup rates declined.
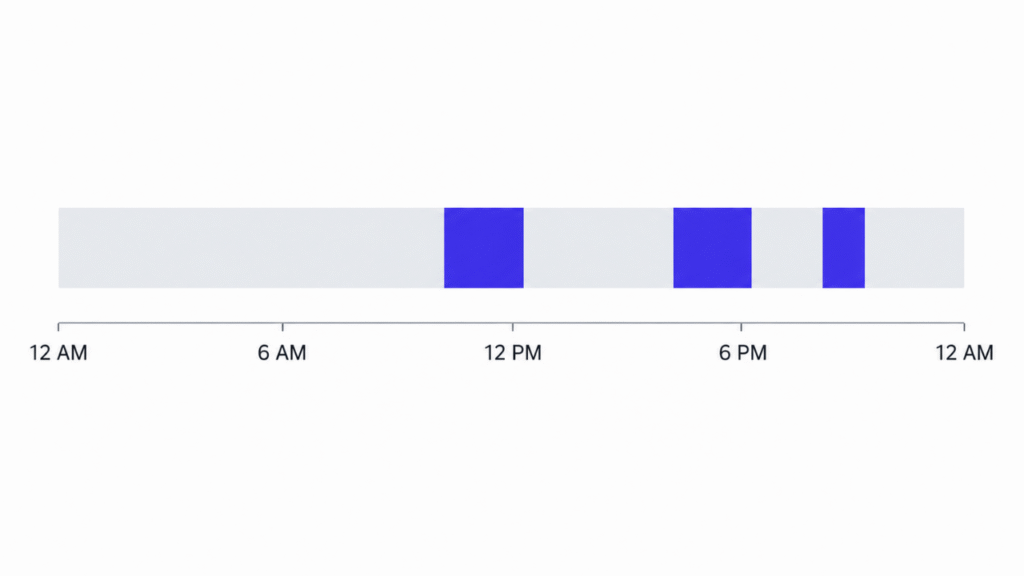
People may be in meetings, commuting, having lunch, or simply less likely to answer an unfamiliar number. The data showed that connectivity tends to cluster around a few periods when people are more available.
This has a direct impact on how outbound AI calling campaigns should be scheduled.
Instead of spreading the same number of calls evenly across the day, teams can concentrate more of their calling volume during periods when recipients are more likely to answer.
Calling Windows Will Vary by Audience
The three windows identified in the dataset apply specifically to campaigns targeting working professionals in India.
They should be used as a starting point rather than a fixed schedule for every campaign.
A campaign targeting retirees, students, business owners, or shift workers may produce a different connectivity pattern. The important finding is that pickup rates tend to cluster around specific periods rather than remaining consistent throughout the day.
Businesses should therefore analyze their own call data and build a connectivity curve for each major audience or campaign.
Retry Timing Matters Too
Calling windows can also be used to improve retry strategies.
If a lead does not answer during the 10 AM to 12 PM window, repeatedly calling them during the same period may not produce a different result.
The next attempt can instead be moved to the 4 PM to 6 PM or 8 PM to 9 PM window.
This gives teams another way to improve cumulative connectivity without increasing the number of leads or significantly increasing total call volume.
Practical Takeaways
- Concentrate outbound call volume within the periods that generate the highest connectivity.
- Use 10 AM to 12 PM, 4 PM to 6 PM, and 8 PM to 9 PM as starting benchmarks for campaigns targeting working professionals in India.
- Build separate calling patterns for audiences with different daily routines.
- Move retries into a different high-performing window when the first call goes unanswered.
- Track pickup rates by time of day instead of relying only on overall campaign pickup rates.
- Use off-window calls as additional opportunities rather than making them the foundation of campaign volume.
For the campaigns analysed, three relatively short windows carried most of the day’s connectivity. Scheduling more calls around these periods can help reduce the cost per successful contact without requiring additional leads.
| BUSINESS IMPACT: Concentrating calling volume into proven windows lowers cost per contact without needing a single additional lead. |
What Causes AI Voice Calls to Fail?
The nine findings above show the factors associated with stronger AI call performance. The same dataset also revealed several recurring patterns in calls that ended early or failed to reach their intended goal.
Across the analysis, seven common failure patterns appeared repeatedly.
| Failure Pattern | What Happens |
|---|---|
| Slow response at the wrong moment | A pause closer to the P95 latency of 2.1 seconds can interrupt the conversation and affect trust. |
| A voice that sounds robotic | Synthetic-sounding default voices caused users to disengage faster than more natural voices. |
| A stiff, scripted opening line | The first few seconds of the conversation had a significant impact on whether users stayed on the call. |
| Avoiding the “Are you a bot?” question | Clearly confirming AI identity helped build trust when asked. Avoiding the question had the opposite effect. |
| Calling outside the strongest windows | Pickup rates declined outside the 10 AM to 12 PM, 4 PM to 6 PM, and 8 PM to 9 PM windows for working professionals. |
| Continuing to use a number after reputation declines | Pickup rates could fall towards 20% as calling numbers were used across larger lead volumes. |
| No clear goal for the conversation | Open-ended calls performed less consistently than conversations designed around one defined objective. |
How to Identify These Problems Early
Most of these issues can be detected by regularly reviewing call performance.
Track P95 latency, not only median latency:
Median response time across the dataset remained below one second, but slower responses reached approximately 2.1 seconds at P95. These slower moments are more likely to interrupt the natural flow of a conversation.
Review calls that end within the first 15 seconds:
Early disconnects can help identify problems with opening lines, voice quality, response speed, or conversation flow.
Monitor pickup rates as calling numbers are used:
New numbers achieved pickup rates close to 48% across their first 1,000 leads, but some call categories later dropped towards 20%. Rotating numbers before performance declines can help maintain connectivity.
Check whether every call has one clearly defined objective:
Pre-sales qualification and webinar attendance performed strongly because the AI had a specific outcome to work towards. Open-ended conversations required more careful design.
Most AI Call Failures Have an Identifiable Cause
The failure patterns found in the dataset were generally linked to measurable parts of the calling process.
Teams can monitor response latency, early disconnects, number reputation, pickup rates, calling windows, and goal completion to identify where performance is declining.
Reviewing these metrics regularly makes it easier to catch problems before they affect a larger share of calls.
How DialNexa’s Results Compare With Published Industry Benchmarks
To put the results from the one-million-call dataset into context, we compared two key metrics with published benchmarks for traditional call centers and outbound calling: pickup rate and user-initiated drop-off.
AI Voice Performance vs. Published Benchmarks
| Metric | DialNexa Dataset | Published Benchmark |
|---|---|---|
| First-attempt pickup rate | 48% | Cold outbound connect rates typically range from 8% to 20%, with right-party contact averaging around 27% |
| User-initiated drop-off | Under 3% | Typical call abandonment rates range from 5% to 8%, with under 3% generally considered best-in-class |
The 48% first-attempt pickup rate in the DialNexa dataset is considerably higher than published cold outbound connect-rate benchmarks.
There is an important factor to consider when interpreting this difference.
Many of the outbound calls in the DialNexa dataset involved warmer leads, such as people who had registered for a webinar or downloaded a pricing guide. Traditional cold-calling benchmarks often include prospects who have had no previous interaction with the business.
A higher pickup rate is therefore partly expected based on the type of leads being contacted. The difference should not be attributed entirely to the technology.
How the Drop-Off Rate Compares
Across the DialNexa dataset, less than 3% of calls ended because the user hung up first.
Published call abandonment benchmarks generally range from 5% to 8%, while rates below 3% are commonly considered best-in-class.
This comparison also requires some context.
Traditional call abandonment rates often measure people who hang up before reaching an agent, including while waiting on hold or navigating an IVR system.
DialNexa’s user-initiated drop-off metric measures people who hang up after the AI conversation has already started.
Since the two metrics measure different stages of the call, they should be treated as directional context rather than a direct like-for-like comparison.
Once a conversation begins, factors such as voice quality, response latency, opening lines, and conversation design have a direct impact on whether the user remains engaged.
Published Benchmark Sources
The external benchmarks referenced in the analysis include:
These comparisons provide useful context for the results, but differences in lead intent, call type, and metric definitions should always be considered when comparing AI-assisted calling with traditional call center benchmarks.
Five Market Signals Shaping Voice AI Adoption
The one-million-call dataset shows how AI voice agents are performing in real business conversations. Broader market research also shows how quickly Voice AI and conversational AI adoption is growing in India and globally.
Here are five market signals that provide additional context for the findings in this report.
1. India’s Voice AI Market Could Reach $958 Million by 2030
India’s Voice AI market is projected to grow from approximately $153 million in 2024 to $958 million by 2030.
That represents a 35.7% compound annual growth rate (CAGR), driven in part by increasing smartphone usage and demand for multilingual voice technologies.
Source: NextMSC, 2026
2. India’s Conversational AI Market Could Reach $5.9 Billion by 2034
The broader conversational AI market, which includes both voice and chat-based technologies, is also expected to expand significantly.
India’s conversational AI market is projected to grow from approximately $653 million in 2025 to $5.9 billion by 2034, representing a 25.6% CAGR.
Source: IMARC Group, 2026
3. Conversational AI Could Reduce Contact Center Labor Costs by $80 Billion
Gartner estimates that conversational AI could reduce global contact center labor costs by approximately $80 billion by 2026.
Automated interactions are also expected to increase from around 1.6% of customer interactions to roughly one in every ten interactions.
Source: Gartner, cited via Master of Code Global, 2026
4. 88% of Contact Centers Already Use Some Form of AI
AI adoption within contact centers is already widespread.
Approximately 88% of contact centers worldwide now use some form of AI.
The global AI customer service market is also projected to reach approximately $15.1 billion in 2026 and grow to $117.9 billion by 2034.
Source: Lorikeet AI Customer Service Statistics, 2026
5. Financial Services Are Among the Leading Adopters
More than 70% of financial and service-sector companies are expected to have deployed conversational AI by 2026.
This aligns with the pattern seen in the DialNexa dataset, where BFSI was one of the two leading sectors for AI voice adoption, alongside EdTech.
Another market study found that 89% of customers say they are more likely to choose a brand that offers Voice AI support, suggesting that customer expectations around automated voice interactions are also changing.
Sources: World Economic Forum, cited via SquadStack, 2026; Market.us Voice AI Agents Market Report, 2025
What These Market Signals Show
Taken together, these figures show a market that is growing quickly:
- India’s Voice AI market: $153M in 2024 → $958M by 2030
- India’s conversational AI market: $653M in 2025 → $5.9B by 2034
- Potential contact center labor cost reduction: $80B
- Contact centers already using AI: 88%
- Financial and service companies expected to deploy conversational AI: 70%+
- Customers more likely to choose brands offering Voice AI support: 89%
The DialNexa dataset provides a view of what happens inside active AI calling systems. These broader market figures provide context for how quickly businesses and customers are adopting the technology.
| Signal | What It Says | Source |
|---|---|---|
| $153M → $958M | India’s Voice AI market is on track to grow from about $153 million in 2024 to about $958 million by 2030, a 35.7% yearly growth rate, pushed by smartphone use and multilingual voice AI. | NextMSC, 2026 |
| $653M → $5.9B | India’s broader conversational AI market, chat and voice combined, is forecast to grow from $653 million in 2025 to $5.9 billion by 2034, a 25.6% yearly growth rate. | IMARC Group, 2026 |
| $80B | Gartner expects conversational AI to cut global contact center labor costs by $80 billion by 2026, as automated interactions climb from about 1.6% to roughly 1 in 10. | Gartner, via Master of Code Global, 2026 |
| 88% | Of contact centers worldwide now use some form of AI. The global AI customer service market is on track to hit $15.1 billion in 2026, and $117.9 billion by 2034. | Lorikeet AI Customer Service Statistics, 2026 |
| 70%+ | Of financial and service sector companies are expected to have deployed conversational AI by 2026, in line with what this dataset shows in BFSI directly. | World Economic Forum, via SquadStack, 2026 |
| 89% | Of customers say they’re more likely to choose a brand that offers voice AI support. Low drop-off and fast response times turn into a real business advantage. | market.us Voice AI Agents Market Report, 2025 |
Recommendations: What Businesses Should Do With These Findings
The findings from more than one million AI-assisted business calls point to different priorities depending on how teams plan to use Voice AI.
Here are the key recommendations for sales, marketing, contact center, product, and operations teams.
For Sales Teams
- Start with pre-sales lead qualification, which was the largest and most successful use case in the dataset.
- Consider routing inbound leads to AI first. Inbound calls achieved an 89% goal completion rate and had a user-initiated disconnect rate of just 0.01%.
- Evaluate outbound calling numbers across their complete retry cycle rather than judging performance from the first attempt.
- Track cumulative connectivity alongside first-attempt pickup rates. Retries helped some campaigns increase connectivity from an initial 48% pickup rate to more than 70%.
For Marketing Teams
- Use AI voice agents for webinar and event attendance, which was the second strongest use case in the dataset.
- Concentrate outbound campaigns around the three strongest calling windows identified for working professionals: 10 AM to 12 PM, 4 PM to 6 PM, and 8 PM to 9 PM.
- Monitor number reputation as campaigns scale.
- Rotate outbound numbers before declining reputation begins to significantly affect pickup rates.
For Contact Center Teams
- Track P95 response latency alongside median latency. Median latency remained below one second, while P95 reached approximately 2.1 seconds.
- Include retry logic in outbound campaigns from the beginning.
- Test speech-to-speech models for customers who regularly switch between languages.
- Include English, Hindi, and Hinglish conversations when testing Voice AI for Indian customers.
For Product Teams
- Cache frequently used responses where appropriate to reduce response latency.
- Run speech recognition and response generation in parallel where possible.
- Design the system to begin preparing likely responses before the caller has completely finished speaking.
- Clearly confirm that the caller is speaking with an AI when asked. The dataset showed that transparency helped build trust.
- Start with structured conversations built around one clear objective before expanding into more open-ended use cases.
For Operations Leaders
- Begin with the highest-volume structured use case and expand after performance has been established.
- Review pickup rate, P95 latency, and user-initiated drop-off together rather than treating them as unrelated metrics.
- Compare lead volume with the number of conversations human teams can realistically handle.
- Use AI voice coverage where call volume exceeds team capacity, particularly for repetitive or time-sensitive conversations.
The recommendations above come directly from patterns observed across the dataset. They provide a practical starting point for teams evaluating where AI voice can have the greatest impact and which performance metrics should be monitored after deployment.
The Bottom Line
After analyzing more than one million AI-assisted business calls across India, the data shows that Voice AI performance depends on several factors working together.
Voice quality can help an AI agent start a conversation. The outcome of that conversation is also influenced by number reputation, retry timing, response speed, language handling, conversation design, and calling windows.
Here is a quick summary of the nine findings from the analysis.
| # | Finding | Key Insight |
|---|---|---|
| 01 | Call duration | Most calls are short, but 120+ calls lasted more than 20 minutes when the conversation required it. |
| 02 | Number reputation | New numbers achieved close to a 48% pickup rate across their first 1,000 leads. Structured retries pushed cumulative connectivity above 70% in some campaigns. |
| 03 | In-call retention | Less than 3% of users hung up first. Voice quality, conversation design, and transparency influenced retention. |
| 04 | Response latency | Median response latency stayed under one second, while P95 latency was approximately 2.1 seconds. |
| 05 | Language and code-switching | English, Hindi, and Hinglish were the most-used language patterns. Speech-to-speech models handled mixed-language conversations more consistently. |
| 06 | Use case performance | Pre-sales lead qualification was the largest and most successful use case, followed by webinar and event attendance. |
| 07 | Industry adoption | EdTech and BFSI were the two leading sectors for AI voice adoption in the dataset. |
| 08 | Inbound vs. outbound | Inbound calls achieved approximately 89% goal completion, averaged 13 minutes, and recorded a 0.01% user-initiated disconnect rate. |
| 09 | Calling windows | 10 AM to 12 PM, 4 PM to 6 PM, and 8 PM to 9 PM generated most of the connectivity for campaigns targeting working professionals. |
The findings also show why evaluating a Voice AI system based on the voice model alone provides an incomplete picture.
A fast response can affect whether a conversation feels natural. Retry timing can determine whether a lead is reached at all. Language handling affects whether the AI can follow the way customers actually speak. Call timing and number reputation influence connectivity before the conversation even begins.
These factors need to be measured together when businesses evaluate AI calling performance.
The dataset also points to clear starting points for businesses adopting Voice AI. Structured use cases such as lead qualification and event attendance performed strongly, while inbound calls recorded an 89% goal completion rate. For outbound campaigns, retry strategies helped increase cumulative connectivity beyond 70% in some cases.
The results provide a practical benchmark for businesses evaluating AI voice agents in India and show which parts of the calling process deserve the most attention as deployments scale.
About This Research
This analysis is based on more than one million AI-assisted business calls made and received through the DialNexa platform on behalf of companies operating in India.
The dataset included approximately 84% outbound and 16% inbound calls, with English, Hindi, and Hinglish conversations represented. The primary use cases included pre-sales lead qualification and webinar or event attendance, while EdTech and BFSI were the leading industries represented.
Report compiled: August 2026
Data source: DialNexa

This is a well-researched and practical report that provides valuable real-world insights into AI voice performance using data from over one million production calls.
The clear focus on pickup rates, response latency, retries, language switching, and conversation design makes the findings especially useful for businesses evaluating AI voice solutions.
This section gives a practical look at AI voice performance, especially the importance of latency, Hinglish support, call timing, and clearly defined use cases. The detailed benchmarks and failure patterns make the insights useful for teams planning and optimizing AI calling campaigns.
This report offers a detailed and practical view of AI voice performance, covering pickup rates, retries, latency, conversation length, and user engagement. The clear methodology and transparent discussion of dataset limitations make the findings especially useful for businesses evaluating AI calling.