

How to Calculate Shrinkage in BPO for Executive Leaders
TL;DR
The BPO shrinkage formula is Shrinkage % = (Total Unproductive Hours / Total Paid Hours) x 100. Add up planned time (breaks, training, meetings) and unplanned time (absenteeism, downtime), divide by total paid hours, and multiply by 100. In a worked example of 4,720 unproductive hours out of 16,000 paid hours, that comes to 29.5% shrinkage, a healthy result for most BPOs.
This guide breaks that number down for executive decision-making: what drives it, how to calculate it step by step, how to convert it into required headcount, and how AI voice agents are starting to remove shrinkage entirely from parts of the operation. A healthy BPO typically runs at 30 to 35% total shrinkage, split between planned and unplanned components.
Introduction
Shrinkage is one of the few workforce metrics almost every contact centre agrees on. Most contact centre professionals put the healthy range at 30 to 35% of paid agent time, and the widely cited Dimension Data Global Benchmarking Report puts the industry average at 35%, according to Call Centre Helper.
That consensus matters because shrinkage is one of the few numbers that connects a workforce management spreadsheet directly to the P&L. Get it wrong by even a few percentage points, and the error doesn’t stay buried in a WFM report. It shows up as overstaffed shifts, missed SLAs, or agents quietly burning out under call volume no one planned for.
Shrinkage, in its simplest form, is the percentage of time you pay agents for when they aren’t actively helping customers. The basic formula is straightforward: divide the total hours of non-productive time by the total hours paid, then multiply by 100 to get your percentage.
But for C-suite leaders, mastering the BPO shrinkage formula is about much more than a simple calculation. It’s a critical lever for maximizing ROI on your largest operational expense: your people. This guide walks through where shrinkage comes from, how to calculate it with a real worked example, how to turn that number into an accurate staffing plan, and where AI voice agents are starting to remove shrinkage from the equation entirely.
Why Mastering Shrinkage Calculation Drives Profitability
For any executive in the BPO world, shrinkage isn’t just an operational metric buried in a workforce management report. It’s a direct reflection of your operational efficiency and a primary driver of your P&L statement.
An accurate shrinkage calculation is a vital financial indicator, shaping everything from payroll and SLA compliance to your overall competitive edge and EBITDA margins.

The financial stakes here are enormous. Let’s model a mid-sized BPO with 500 agents, each with a fully loaded cost of £15 per hour. A seemingly small 5% miscalculation in your shrinkage forecast silently adds over £780,000 to your annual payroll. You end up overstaffing to cover a gap you can’t quite define, paying for phantom capacity that is never actually available to serve customers.
The True Cost of Inaccurate Shrinkage
When shrinkage isn’t managed with precision, it sets off a domino effect that ripples through the entire organisation.
- Inflated staffing costs: without a reliable number, you’re forced to over-hire. For a 1,000-agent operation, a 3% overstaffing buffer can translate to unnecessary payroll expenditure of over £1.2 million annually.
- Missed SLAs: underestimating shrinkage means fewer agents on the floor than forecast, resulting in longer queues and abandonment rates potentially rising from 3% to over 10%.
- Poor customer experience: understaffing erodes CSAT scores, which can lead to client churn and long-term brand damage.
- Agent burnout: agents left to pick up the slack face back-to-back calls with no breathing room, fueling higher attrition and pushing shrinkage even higher.
Shrinkage isn’t just a number for the WFM team, it’s a C-suite concern. An accurate calculation provides the data-driven foundation for building resilient, cost-effective staffing models.
The Strategic Impact of Shrinkage on BPO Operations
To see why this matters at board level, it helps to compare an unmanaged floor against one where shrinkage is actively tracked and managed.
| Business Area | Unmanaged Shrinkage (e.g. 35%) | Managed Shrinkage (e.g. <30%) |
|---|---|---|
| Financial Health | Inflated payroll, SLA penalties exceeding £100k annually | Optimised payroll, minimal financial risk |
| Service Levels | Missed targets, abandonment rates 8-12% | Reliable SLA performance, CSAT above 90% |
| Agent Well-being | High burnout, attrition rates 40%+ | Balanced workloads, attrition below 25% |
| Client Relations | Strained relationships from performance issues | Trust-based partnerships, consistent performance |
From Operational Metric to Strategic Imperative
When you truly understand the BPO shrinkage formula, you shift it from a reactive problem to a proactive strategy. A 35% shrinkage rate means for every 100 agents on the payroll, only 65 are actually available to take a call at any given moment.
This strategic mindset matters more as technology evolves. Understanding how AI voice agents transform CX opens a direct path to reducing shrinkage, since AI agents can handle routine interactions without needing breaks, holidays, or training.
Breaking Down the Components of BPO Shrinkage
Shrinkage isn’t some big, vague monster, it’s a mix of distinct activities, and each one needs its own game plan. Broadly speaking, you can split all these activities into two main camps: the things you plan for and the things that just happen.
Planned Internal Shrinkage: The Variables You Control
Planned shrinkage covers all the essential, scheduled activities that keep a healthy BPO running. They pull agents away from handling contacts, but they are entirely within your control to schedule and manage.
- Scheduled breaks: two 15-minute breaks and a 30-minute lunch in an 8-hour shift account for 12.5% of an agent’s paid time.
- Team meetings and huddles: a daily huddle and weekly team meeting can easily add another 3-5% to your shrinkage.
- Training and development: a mandatory 4 hours of training per month consumes 2.5% of an agent’s time, rising to 4-7% in complex environments.
- One-on-one coaching: weekly 30-minute performance reviews typically contribute another 2-4%.
The real strategic play here isn’t to get rid of these components, it’s to be smart about when they happen. Moving a 1-hour team meeting from a peak call volume slot to a quieter period can make a world of difference to your service levels.
Unplanned External Shrinkage: The Curveballs
Unplanned shrinkage is the volatile stuff, the unscheduled events that blow a hole in your coverage. A consistently high rate of unplanned shrinkage is a major red flag, often pointing to deeper issues in the operation.
- Unplanned absenteeism: often sitting between 5-8% across the industry, spiking to over 12% in centres with poor employee engagement.
- System downtime: even 99.9% uptime still means over 8 hours of downtime per year, adding an unexpected 1-3%.
- Tardiness and early departures: 10 agents arriving 15 minutes late daily adds up to 50 lost hours per month for that group alone.
A high rate of unplanned absenteeism isn’t just a WFM headache, it’s a leadership problem. It’s often a symptom of low morale, burnout, or a toxic work culture.
Employee attrition also fuels shrinkage indirectly. In the Indian BPO industry, turnover can hit a staggering 35%, creating a relentless demand for recruitment and training. You can read more about these Indian BPO industry challenges for the full picture.
Typical Shrinkage Component Benchmarks in BPO
Once you know which components you’re dealing with, industry ranges give you a sense-check for whether your own numbers are typical or worth investigating.
| Shrinkage Component | Category | Benchmark Range |
|---|---|---|
| Breaks and Lunch | Internal (Planned) | 8% – 12% |
| Absenteeism | External (Unplanned) | 5% – 8% |
| Training and Coaching | Internal (Planned) | 6% – 11% |
| Team Meetings | Internal (Planned) | 3% – 5% |
| System Downtime | External (Unplanned) | 1% – 3% |
| Total Target Range | Combined | 30% – 35% |
A Practical Guide to Nailing Your Shrinkage Calculation
Ballpark figures lead to bloated payrolls and missed SLAs. A solid, data-driven number lets you build a resilient and cost-effective operation.
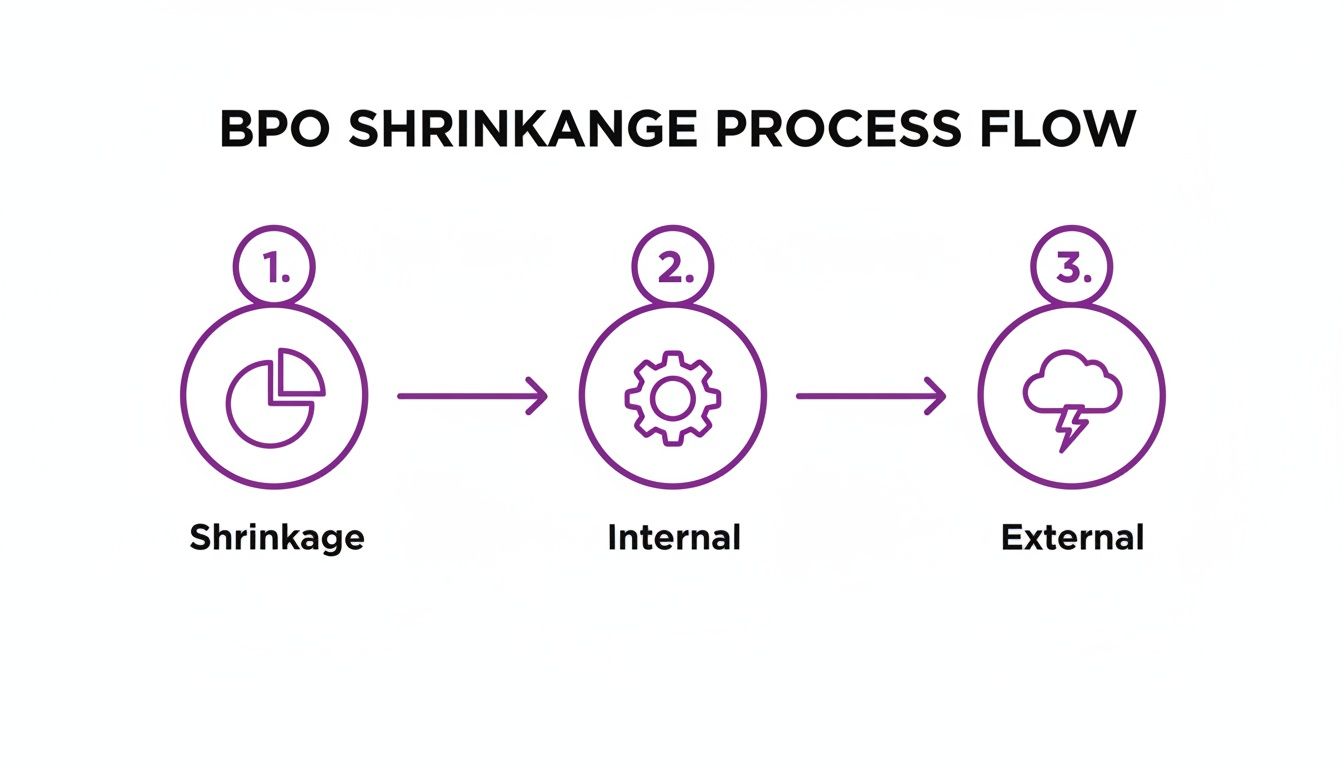
Shrinkage % = (Total Hours of Unproductive Time / Total Hours Paid) x 100
This simple equation takes all those disconnected activities, from coffee breaks to system outages, and rolls them into a single, powerful percentage.
Making It Real: A Calculation Scenario
Let’s walk through a practical example. Imagine you’re running a team of 100 agents, all on standard 40-hour-a-week contracts. That gives you a baseline of 16,000 total paid hours for a four-week month.
- Unplanned absenteeism: 1,280 hours lost to sick days and other unexpected time off (an 8% unplanned absence rate).
- Scheduled breaks: 2,000 hours (1 hour/day/agent).
- Training and coaching: 800 hours (5% of total time).
- Team meetings: 480 hours (3% of total time).
- System downtime: 160 hours from an unexpected CRM outage (a 1% impact).
Total unproductive time for the month comes to 4,720 hours. Shrinkage % = (4,720 / 16,000) x 100 = 29.5%. That means for every 100 agents on your payroll, only 70.5 are available for customer-facing work at any given time.
From Percentage to People: Staffing Strategically
Your shrinkage rate tells you exactly how many extra people you need on your roster to meet your service levels.
Required Roster FTEs = (Required Productive FTEs) / (1 – Shrinkage %)
If your forecast shows you need 100 agents actively on calls to hit your targets, using our calculated 29.5% shrinkage: Required Roster FTEs = 100 / (1 – 0.295) = 100 / 0.705 = 141.8. You’d need to schedule around 142 agents to guarantee 100 are ready to work.
This isn’t overstaffing, it’s correct staffing. If you had just scheduled 100 agents, you’d constantly be running with only 70 available.
Quick and Easy Spreadsheet Formulas
You don’t need fancy software to start tracking this properly:
- Shrinkage Percentage: =(SUM(UnproductiveHours) / TotalPaidHours) * 100
- Required Roster FTEs: =RequiredProductiveFTEs / (1 – (ShrinkagePercentage / 100))
When you’re drilling down into absenteeism specifically, tools like a Bradford Factor Score Calculator can offer deeper insight into absence patterns, refining the unplanned absenteeism part of your calculation.
Applying Shrinkage Data in Strategic Workforce Planning
Getting a handle on your shrinkage percentage is a great start, but the real strategic value is unlocked when you apply that number to business decisions. Top-tier workforce management teams don’t just report on shrinkage, they weave it into the fabric of their staffing models.
From Static Percentages to Dynamic Staffing
A 30% daily shrinkage rate doesn’t mean you lose 30% of your staff like clockwork from 9 AM to 5 PM. Intraday shrinkage can fluctuate wildly from one 15-minute interval to the next, driven by staggered breaks, meetings, and shift changeovers.
If your WFM team plans for 50 agents to handle an 11 AM peak, and that slot coincides with a team huddle and shift handover, actual intraday shrinkage could spike to 45%, leaving only 27 available agents instead of the expected 35.
The real question is not what your daily shrinkage is, but how it fluctuates by interval, and how your staffing plan absorbs those peaks.
Building a Resilient Forecasting Model
A sophisticated approach uses historical shrinkage data to build a dynamic model that predicts it with accuracy.
- Seasonal adjustments: shrinkage creeps up during major holidays and summer vacation periods, for example increasing planned shrinkage from 30% to 33% in December.
- Day-of-week patterns: unplanned absenteeism often spikes on Mondays and Fridays by as much as 2-3 percentage points.
- Time-of-day fluctuations: if team huddles are always at 9:15 AM, the plan should roster extra staff for that interval.
Connecting Shrinkage to Agent Performance
Shrinkage data also gives you a lens through which to view agent and team performance. Consistently high unplanned shrinkage within a specific team might point to a management or morale issue that requires HR intervention.
Pairing shrinkage trends with your BPO quality parameters scorecard often reveals whether a team is facing a staffing gap or a quality-control gap. That diagnosis is usually made by the floor leader, so pairing it with this team leader KPI guide helps separate a genuine staffing gap from a coaching gap.
To take this further, exploring voice agent performance metrics can provide a more complete picture of how availability impacts overall results.
How AI and Automation Are Redefining Shrinkage
For years, the conversation around shrinkage has been about managing human limitations. We build complex models to forecast and staff around breaks, training, and sick days simply because they’re an unavoidable part of employing people.
But what happens when a part of your workforce has no shrinkage at all? For leaders, the focus is no longer just on managing shrinkage but on strategically eliminating it wherever possible.
The Zero-Shrinkage Workforce
AI voice agents completely flip the script on the classic shrinkage calculation. An AI designed to handle Tier-1 support calls or qualify inbound leads can run 24/7 without ever needing any of the time-off activities that drive shrinkage numbers up.
- Breaks and lunches: an AI agent doesn’t need them.
- Training and coaching: AI models are updated offline, never pulled off the floor for a coaching session.
- Meetings and huddles: your AI workforce won’t be attending the morning team huddle.
- Absenteeism and sick days: an AI is never out sick or unexpectedly unavailable.
An India voice AI report analysing over a million AI-assisted business calls found containment and consistency patterns that track closely with this shift, since AI-handled call volume carries none of the scheduling variability that drives human shrinkage.
Automate 30% of inbound call volume and the entire shrinkage calculation for that chunk of work vanishes. For a team of 100 agents, that’s the equivalent of adding over 10 productive FTEs without adding a single penny to payroll.
Reframing the Strategic Approach
This shift turns shrinkage management from a reactive chore into a proactive hunt for automation opportunities. The question changes from “How can we get our 35% shrinkage down?” to “Which share of our call volume can we automate to remove its shrinkage entirely?”
- High-volume, low-complexity tasks: automating password resets or order status lookups carves out a segment of your operation where shrinkage no longer exists.
- After-hours support: AI agents can cover off-peak hours with 0% shrinkage, avoiding shift premiums of 15-20% for human staffing.
- Scaling for peaks: scale AI capacity instantly for holiday rushes instead of the 4-6 week ramp-up time needed for seasonal staff.
None of this replaces your human workforce. It narrows the slice of work that shrinkage even applies to, which is a different and more durable kind of efficiency gain than another round of schedule optimisation.
Automation’s Broader Impact on Shrinkage
Broader automation across your operation plays a part too. When you automate backend processes, you cut down the time human agents spend on after-call work, a core piece of internal shrinkage.
A holistic view of business process automation benefits shows how these efficiencies feed directly back into shrinkage rates. Automating CRM updates or ticket logging can shave 30-60 seconds off every agent’s wrap-up time, which adds up to hundreds of reclaimed hours daily across a large floor.
Conclusion
The BPO shrinkage formula is simple on paper, unproductive hours divided by total paid hours, times 100, but getting it right is what separates a resilient operation from one that is constantly firefighting missed SLAs and burnt-out agents.
At DialNexa, we believe optimising your workforce means tackling inefficiency at its core. Our voice AI agents work 24/7 with zero shrinkage, freeing up your team for the work that matters most.
FAQs
1. What is the formula of shrinkage in BPO?
Shrinkage % = (Total Unproductive Hours / Total Paid Hours) x 100. Unproductive hours include both planned time (breaks, training, coaching, meetings) and unplanned time (absenteeism, tardiness, system downtime). Divide that by all hours you pay agents for, then multiply by 100.
2. What is the formula of shrinkage in BPO with an example?
Take 100 agents on 40-hour weeks over a 4-week month, 16,000 total paid hours. If unproductive time totals 4,720 hours, shrinkage = (4,720 / 16,000) x 100 = 29.5%. That means only about 70 of every 100 paid agents are available for calls.
3. How is shrinkage calculated in a call center?
The calculation is identical to BPO shrinkage: sum every hour agents are paid but not handling contacts, divide by total paid hours, and multiply by 100. Track it per interval, not just daily, since intraday shrinkage during huddles can spike well above the daily average.
4. What is the attendance shrinkage formula in BPO?
Attendance shrinkage isolates absence-driven loss: Attendance Shrinkage % = (Unplanned Absence Hours / Total Paid Hours) x 100. Most centers see 5 to 8% here, above 12% usually signals engagement or morale problems rather than a scheduling issue.
5. What is a good shrinkage percentage in BPO?
A total shrinkage rate of 30 to 35% is generally considered healthy, a range confirmed by the Dimension Data benchmarking report cited across the industry. Below 30% is excellent, consistently above 35% is a signal to break the number into planned and unplanned components and target the biggest driver first.
6. How do you convert shrinkage into required staffing?
Use Required Roster FTEs = Required Productive FTEs / (1 – Shrinkage %). To keep 100 agents productive at 29.5% shrinkage: 100 / (1 – 0.295) = 142 agents rostered. This is correct staffing, not overstaffing, and the payoff compounds since even a 5-point shrinkage reduction on a 100-agent floor can free up 6 to 7 additional FTEs without adding headcount.

Excellent breakdown of BPO shrinkage and its strategic impact on staffing, customer experience, and profitability. The practical examples and AI-driven insights make this a valuable guide for leaders looking to build more efficient, resilient, and future-ready operations.