The 10 Essential Quality Parameters for BPO Success in 2025
In today's competitive landscape, Business Process Outsourcing (BPO) is no longer just a cost-saving measure; it has evolved into a strategic driver of customer experience and revenue growth. For VPs, Directors, and CXOs, understanding and implementing the correct quality parameters for BPO is crucial for steering your organisation toward market leadership and sustainable success. Simply tracking basic metrics like call duration is an outdated approach that leaves significant value on the table.
The modern BPO partnership, especially one enhanced by technologies like AI voice agents, demands a more sophisticated and multi-faceted approach to quality measurement. Focusing on the right set of Key Performance Indicators (KPIs) ensures your outsourcing partner is aligned with core business objectives, from enhancing customer loyalty to boosting your bottom line. This comprehensive roundup moves beyond surface-level metrics to provide the C-suite with actionable insights into the ten most critical parameters that truly define BPO performance.
This guide will dissect each KPI, providing clear definitions, measurement formulas, and industry-specific benchmarks. We will explore how to translate these numbers into strategic improvements and demonstrate how advanced solutions are not just meeting but exceeding traditional standards. Prepare to re-evaluate your quality framework, challenge outdated assumptions, and unlock the full strategic potential of your outsourcing investment to create a tangible competitive advantage.
1. First Call Resolution Rate (FCR)
First Call Resolution (FCR) is one of the most vital quality parameters for BPO success, measuring the percentage of customer interactions fully resolved in the initial contact. A high FCR signifies efficiency and competence, indicating that agents can address customer needs without necessitating follow-up calls, emails, or transfers. This metric is a powerful indicator of both operational excellence and customer satisfaction.
For senior leaders, FCR is a direct lever for cost control and brand reputation. Every follow-up call represents an additional operational cost and a potential point of customer friction. By resolving issues on the first attempt, organisations reduce call volume, optimise agent workload, and significantly enhance the customer experience. A customer whose problem is solved quickly and effortlessly is far more likely to remain loyal.
How to Measure FCR and Industry Benchmarks
The standard formula for calculating FCR is straightforward:
FCR (%) = (Total Number of Issues Resolved on First Contact / Total Number of Customer Issues) x 100
To gather accurate data, organisations often use post-call IVR surveys, agent disposition codes, or analytics from CRM systems. Benchmarks vary by industry, but a common target is between 70-75%.
- E-commerce & Retail: Aim for 75-80%, as queries are often transactional (e.g., returns, order status).
- BFSI: A benchmark of 65-75% is more realistic due to complex, multi-step compliance and verification processes.
- EdTech: Targets range from 70-80%, focusing on resolving enrolment and course queries in one touch.
Real-World Impact and Improvement Strategies
High FCR isn't just a number; it translates into tangible business outcomes. For an EdTech platform, resolving a programme inquiry, verifying enrolment criteria, and processing the initial payment in a single conversation prevents lead drop-off and accelerates revenue generation. Similarly, in real estate, an AI voice agent like DialNexa can qualify a lead, provide property details, and book a site visit in one seamless interaction, collapsing the sales cycle.
To improve FCR, focus on these actionable strategies:
- Design Proactive Conversation Flows: Anticipate common follow-up questions and build them into the initial script or AI workflow.
- Empower Agents with Knowledge: Implement a real-time, easily searchable knowledge base that provides instant answers to complex queries.
- Leverage Conversational AI: Use AI tools that support natural, multi-minute conversations to build rapport and uncover the true customer intent, preventing misunderstandings that lead to repeat calls.
- Analyse Follow-Up Patterns: Use conversation analytics to identify why customers call back. Are agents lacking specific training? Is a process broken? Use this data to drive targeted improvements.
2. Connect Rate
Connect Rate is a foundational outbound quality parameter for BPO operations, measuring the percentage of dialled calls that successfully connect to a live person. A high connect rate is a direct reflection of list quality, dialling strategy, and technological efficiency. It signifies that agents or AI systems are spending their time engaging with potential customers rather than navigating voicemails, invalid numbers, or unanswered rings.
For senior leaders, the Connect Rate is a crucial top-of-funnel metric that directly impacts campaign ROI and operational costs. Low connectivity means wasted agent time, higher telecom expenses per successful conversation, and a decelerated sales or service cycle. Maximising this KPI is essential for ensuring that expensive human or AI resources are deployed effectively, engaging in value-driven conversations that lead to business outcomes.
How to Measure Connect Rate and Industry Benchmarks
The calculation for Connect Rate is focused on successful live interactions:
Connect Rate (%) = (Total Number of Live Connections / Total Number of Calls Dialled) x 100
This data is typically captured automatically by dialler systems and CRM platforms. Benchmarks can vary significantly based on data quality and industry, but AI-powered tools are pushing the boundaries of what is possible.
- Real Estate: A standard rate is 40-50%, but with AI diallers, achieving over 85% on property inquiry lists is now feasible.
- EdTech: Typically sees 50-60%, but can reach up to 88% for follow-ups on programme inquiries.
- BFSI: Aims for 60-70%, though platforms like DialNexa can achieve 90%+ on pre-qualification calls.
Real-World Impact and Improvement Strategies
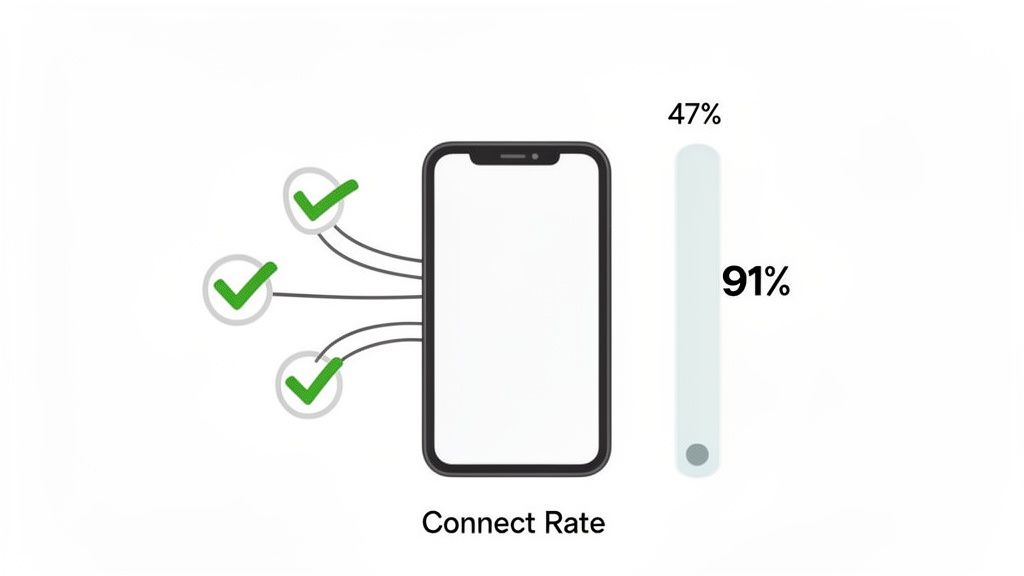
A high connect rate directly accelerates business growth. For a real estate brokerage, improving the connect rate from 47% to 91%, as seen with DialNexa, means more than doubling the number of conversations with qualified leads from the same dataset, dramatically increasing site visit bookings. Similarly, a SaaS company connecting with 85% of its demo-request leads within two hours drastically reduces lead leakage and shortens the sales cycle.
To elevate your Connect Rate, implement these targeted strategies:
- Implement AI-Powered Dialling: Use predictive or AI diallers that optimise call pacing and connect agents only when a live person is on the line.
- Prioritise List Hygiene: Regularly use list cleansing services to scrub invalid numbers, duplicates, and contacts on Do-Not-Call (DNC) registries.
- Optimise Calling Times: Analyse historical data to schedule outbound campaigns during peak contact hours for your specific target audience (e.g., 9 am-5 pm for B2B).
- Leverage AI for Real-Time Adaptation: An AI voice agent can adjust its approach in real-time based on who answers the phone, overcoming one of the key cold calling challenges detailed on dialnexa.com.
- Strategise Re-attempts: Track non-connections using disposition codes and space out repeat dialling attempts by 24-48 hours to avoid caller fatigue.
3. Lead Quality Score
Lead Quality Score is a critical BPO quality parameter that evaluates how effectively an agent, human or AI, qualifies potential customers against predefined criteria. A high score indicates that leads passed to sales are genuinely promising, aligning with the ideal customer profile. This metric is crucial for measuring the ROI of lead generation efforts and ensuring sales teams focus their energy on high-potential opportunities, not chasing unqualified prospects.
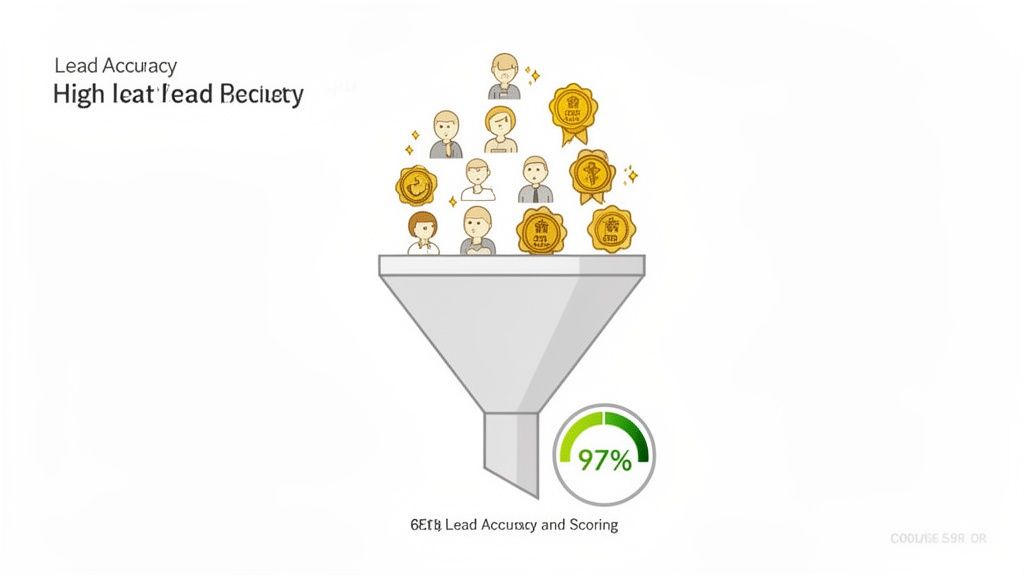
For senior leadership, a reliable Lead Quality Score is the bridge between marketing expenditure and sales revenue. It provides a quantifiable measure of lead generation effectiveness, preventing wasted resources on poorly qualified leads. By ensuring a high standard of qualification at the BPO level, organisations can significantly shorten sales cycles, improve conversion rates, and achieve a more predictable revenue pipeline. An AI-driven system like DialNexa, for instance, matches human judgment with 97% accuracy, proving that automated qualification can deliver high-value leads at scale.
How to Measure Lead Quality and Industry Benchmarks
Lead Quality Score is typically measured on a point-based system or a simple qualified/unqualified basis, tracked via CRM dispositions.
Lead Quality (%) = (Number of Leads Meeting Qualification Criteria / Total Number of Leads Generated) x 100
Qualification criteria are highly industry-specific, and benchmarks should reflect the complexity of the sales process.
- Real Estate: A good benchmark is 80-90% qualification, based on budget, property preferences, and purchase timeline.
- Software/SaaS: Aim for 70-80%, qualifying on use case fit, company size, and decision-maker authority (BANT).
- BFSI: Targets are often 65-75% due to stringent KYC, credit profile, and risk tolerance checks.
Real-World Impact and Improvement Strategies
A high Lead Quality Score directly accelerates business growth. In the software industry, an AI agent can instantly qualify an inbound inquiry by confirming the company size, identifying the core technical need, and verifying the caller's authority, then seamlessly book a demo with the correct sales executive. This eliminates manual screening and ensures the sales team only engages with prospects ready for a serious conversation.
To improve your Lead Quality Score, implement these strategies:
- Define Clear Qualification Criteria: Work with sales to create a precise, measurable definition of a "sales-qualified lead" (SQL).
- Train Agents on the BANT Framework: Ensure consistent assessment by training agents on Budget, Authority, Need, and Timeline.
- Use AI for Consistent Application: Leverage AI voice agents to apply qualification rules without bias or deviation on every single call.
- Analyse Rejected Leads: Regularly review leads marked as "unqualified" to identify patterns. Are your criteria too strict? Is there a misunderstanding of the product value? This feedback loop is essential for refining your model.
4. Average Handling Time (AHT)
Average Handling Time (AHT) is a core efficiency metric among quality parameters for BPO, measuring the average duration of a complete customer interaction. It encompasses talk time, hold time, and after-call work (ACW). While often associated with speed, for senior leaders, a well-managed AHT is about optimising resources and ensuring that conversations are both efficient and effective, not just brief. An ideal AHT signifies that agents are resolving issues promptly without sacrificing quality or customer rapport.
For decision-makers, AHT is a critical lever for workforce management and operational budgeting. Shorter, effective calls mean more customers can be served with the same number of agents, directly impacting staffing costs and service level agreements. However, an obsessive focus on reducing AHT can be counterproductive, potentially leading to unresolved issues and repeat calls, which inflates costs and damages customer satisfaction. The goal is to find the right balance between speed and thoroughness.
How to Measure AHT and Industry Benchmarks
The formula for calculating AHT is a standard in the industry:
AHT (in seconds) = (Total Talk Time + Total Hold Time + Total After-Call Work) / Total Number of Calls
This data is typically captured automatically by the telephony or contact centre platform. Benchmarks for AHT are highly dependent on the complexity of the query.
- BFSI: Averages 2-3 minutes for routine account enquiries but can extend for more complex financial advisory calls.
- E-commerce & Retail: Aims for 2-4 minutes, typically for processing returns or checking order statuses.
- Software/SaaS: Ranges from 3-5 minutes for scheduling a demo or initial technical troubleshooting.
- Real Estate: Property enquiry and qualification calls average 4-6 minutes, focusing on capturing key details and booking viewings.
Real-World Impact and Improvement Strategies
Effective AHT management directly enhances productivity and customer flow. For a SaaS company, using an AI voice agent to handle demo booking calls can standardise the process, ensuring all necessary qualification questions are asked and the meeting is scheduled within a 3-5 minute window, maximising the productivity of the sales team. Similarly, in e-commerce, a streamlined return process call resolved in under four minutes frees up agent capacity for more complex, value-added interactions.
To optimise AHT without compromising service quality, implement these strategies:
- Establish Tiered AHT Standards: Set different AHT targets based on call type and complexity rather than a single, organisation-wide metric.
- Balance AHT with FCR: Coach agents to prioritise resolving the issue on the first call, even if it slightly extends AHT. The cost of a repeat call is always higher.
- Automate After-Call Work: Utilise AI-powered call summarisation and automatic CRM updates to drastically reduce the time agents spend on manual post-call tasks.
- Analyse AHT Outliers: Investigate both exceptionally long and short calls. Long calls may indicate knowledge gaps, while short calls could signal incomplete service. This is where tools that provide AI agent assist can be invaluable.
5. Customer Satisfaction Score (CSAT)
Customer Satisfaction (CSAT) is a direct measure of how happy a customer is with a specific interaction or service. As one of the most immediate quality parameters for BPO, it provides a real-time pulse on agent performance, process effectiveness, and the overall customer experience. A high CSAT score indicates that the BPO is not just resolving issues, but doing so in a way that leaves customers feeling valued and understood.
For senior leaders, CSAT is more than a happiness metric; it is a leading indicator of customer loyalty, retention, and brand perception. A consistently high score signals operational health and a strong competitive advantage. Tracking CSAT helps organisations pinpoint moments of friction in the customer journey and identify agents who excel at building rapport, allowing for the replication of best practices across the team.

How to Measure CSAT and Industry Benchmarks
CSAT is typically measured with a single-question survey immediately following an interaction, asking customers to rate their satisfaction on a scale (e.g., 1-5 or 1-10).
CSAT (%) = (Number of Satisfied Customers [e.g., ratings of 4 and 5] / Total Number of Survey Responses) x 100
This data is collected via post-call IVR, SMS, or email surveys. Industry benchmarks for a good CSAT score often start at 75% or higher.
- Healthcare: Aims for 80-85%, as patient experience directly impacts trust and outcomes.
- E-commerce: Targets 75-80%, focusing on smooth return and order support interactions.
- Real Estate: A benchmark of 80-85% is common, where personalised consultations are critical.
- BFSI: Averages 70-75% due to the procedural and regulatory nature of many interactions.
Real-World Impact and Improvement Strategies
High CSAT scores translate directly to business growth. For a real estate firm, a property consultation that earns a 4.6/5 CSAT because the agent provided expert local insights builds the trust needed to secure a site visit. In EdTech, a program inquiry achieving a 4.5/5 CSAT through personalised course guidance makes a prospective student feel confident in their decision to enrol.
To improve CSAT, focus on these actionable strategies:
- Deploy Timely Surveys: Send CSAT surveys via SMS or email within 15 minutes of the call conclusion for the highest response rates.
- Analyse Low Scores: Implement a quality assurance process to review all low-scoring interactions and provide targeted coaching to agents.
- Leverage AI for Rapport: Use AI voice agents like DialNexa that can hold natural, multi-minute conversations. This human-like interaction builds rapport and significantly boosts satisfaction over robotic, rigid IVR systems. Discover how implementing AI voice agents in 2025 will elevate customer experience on dialnexa.com.
- Set Contextual Targets: Establish different CSAT goals for different interaction types. A simple appointment booking should have a higher target than a complex complaint resolution.
6. Conversion Rate
Conversion Rate is a bottom-line quality parameter for BPO, especially in sales and lead generation contexts. It measures the percentage of interactions that result in a desired business outcome, such as a sale, appointment, or enrolment. While metrics like AHT and FCR measure efficiency, conversion rate directly quantifies the effectiveness of an interaction in generating revenue or achieving a core business goal.
For senior leaders, this metric is the ultimate proof of a BPO's value. A high conversion rate demonstrates that agents or AI systems are not just handling contacts but are actively persuading, assisting, and guiding customers to take valuable actions. This transforms the contact centre from a cost centre into a powerful revenue engine, directly impacting profitability and market share.
How to Measure Conversion Rate and Industry Benchmarks
The formula for Conversion Rate is tailored to the specific business objective:
Conversion Rate (%) = (Total Number of Successful Conversions / Total Number of Qualified Leads or Interactions) x 100
Data is tracked through CRM systems, sales platforms, and disposition codes that mark the final outcome of an interaction. Benchmarks are highly industry-specific and depend on the campaign's nature.
- Software/SaaS: A 15-20% demo-to-trial conversion is a strong benchmark, reflecting effective needs assessment.
- Real Estate: Achieving an 8-12% lead-to-booking conversion is considered excellent, often driven by needs-based property matching.
- EdTech: Aim for 3-9% for programme enrolments, where personalised course-fit discussions are critical.
- E-commerce: A 5-12% repeat purchase conversion from outbound campaigns indicates effective personalised offers.
Real-World Impact and Improvement Strategies
A higher conversion rate has a direct and dramatic impact on revenue. For a BFSI platform, improving account opening conversion from 6% to 10% through clear KYC guidance and benefit explanation translates into thousands of new revenue-generating accounts. Similarly, AI voice agents like DialNexa have demonstrated the ability to lift lead-to-booking rates from a typical 2% to a remarkable 8% by engaging leads in multi-minute, natural conversations that build trust and conviction.
To improve your conversion rate, focus on these actionable strategies:
- Segment Conversion Metrics: Analyse performance by lead source, agent, and customer type to pinpoint high-performing segments and replicate their success.
- Use A/B Testing: Continuously test different scripts, value propositions, and objection-handling techniques to identify the most effective conversational approaches.
- Train for Consultative Selling: Shift agent focus from listing features to understanding customer needs and positioning the solution as the ideal answer.
- Analyse High-Converting Calls: Use call recording and analytics to identify the specific language, questions, and flow used by your top-performing agents and AI.
- Leverage Conversational AI: Implement AI that can hold natural, extended conversations to uncover deeper customer motivations and address underlying concerns, which is key to building the trust needed for conversion.
7. Schedule Adherence Rate
Schedule Adherence Rate measures the percentage of time agents are available and engaged in their scheduled work activities against their planned schedules. For BPOs managing thousands of daily interactions, this metric is a cornerstone of operational discipline, directly impacting service levels and staffing efficiency. High adherence ensures that the right number of agents are available at the right times to handle predicted contact volumes.
For senior leadership, schedule adherence is a critical lever for workforce optimisation and cost management. Low adherence leads to understaffing, which in turn causes longer wait times, higher abandonment rates, and decreased customer satisfaction. Conversely, by maintaining high adherence, organisations can meet their service level agreements (SLAs) consistently, maximise resource utilisation, and ensure a predictable, stable customer support environment.
How to Measure Schedule Adherence and Industry Benchmarks
The calculation for Schedule Adherence is a measure of time spent working versus time scheduled:
Schedule Adherence (%) = (Total Minutes in Adherence / Total Scheduled Minutes) x 100
"Minutes in Adherence" includes all productive time, such as handling calls, completing after-call work, and attending scheduled training. This data is typically tracked automatically through Workforce Management (WFM) software integrated with the telephony system.
- E-commerce & Retail: A target of 95%+ is common, especially during seasonal peaks, to manage high call volumes.
- BFSI: A benchmark of 94%+ is expected to ensure 24/7 support operations are adequately staffed for security and customer queries.
- EdTech: Aim for 96%+ during peak enrolment periods to avoid losing potential students due to long wait times.
Real-World Impact and Improvement Strategies
High adherence directly translates into operational stability and cost savings. For a real estate BPO managing a 50-agent outbound campaign, maintaining a 95% adherence rate ensures that lead generation targets are met consistently. In this scenario, even a small dip in adherence can mean hundreds of missed lead qualification calls per day.
To improve Schedule Adherence, focus on these actionable strategies:
- Set Clear and Realistic Targets: Establish an achievable adherence goal, typically in the 90-95% range, and communicate it clearly.
- Use Workforce Management (WFM) Tools: Deploy WFM software for accurate scheduling, real-time monitoring, and automated reporting of adherence.
- Provide Real-Time Visibility: Give agents access to dashboards showing their own adherence status, empowering them to self-correct.
- Augment with AI Agents: Implement AI voice agents like DialNexa to handle call overflow and manage after-hours traffic, reducing the pressure on human agent adherence as AI operates with 100% adherence 24/7.
- Analyse Non-Adherent Time: Conduct root-cause analysis for agents who consistently miss targets to identify and address underlying issues, such as technical problems or burnout.
8. Quality Assurance Score (QA Score)
The Quality Assurance (QA) Score is a cornerstone among quality parameters for BPO, offering a holistic evaluation of an agent's performance during a customer interaction. It moves beyond simple metrics like call duration to assess the actual quality of the conversation against a predefined rubric. This includes adherence to scripts, compliance with regulations, professionalism, problem-solving effectiveness, and the overall customer experience. A high QA score indicates that an agent is not just handling calls, but is also a brand ambassador.
For senior executives, QA scores are a powerful diagnostic tool for operational health and risk management. They provide a granular view into agent performance, highlighting systemic issues in training, processes, or technology. By monitoring QA trends, leaders can proactively address compliance gaps, reduce customer churn caused by poor service, and ensure brand messaging is delivered consistently and effectively across every single interaction.
How to Measure QA Scores and Industry Benchmarks
QA scores are calculated by evaluating a sample of interactions against a detailed scorecard. Each criterion is given a score, which is then aggregated to produce a final percentage.
QA Score (%) = (Total Points Awarded / Total Possible Points) x 100
Scorecards are typically customised to business goals, but a general industry benchmark for high performance is 90% or above.
- BFSI: A score of 95%+ is often targeted, with a heavy weighting on mandatory compliance elements like regulatory disclosures and consent verification.
- Healthcare: Benchmarks are high (90-95%), focusing on HIPAA compliance, accuracy in appointment scheduling, and demonstrating empathy.
- E-commerce & Retail: A target of 85-90% is common, prioritising product knowledge accuracy, effective upselling, and customer retention efforts.
Real-World Impact and Improvement Strategies
A high QA score directly correlates with improved business outcomes. In real estate, a QA programme can ensure that an AI voice agent like DialNexa consistently qualifies leads by accurately capturing buyer requirements, providing correct property details, and adhering to fair housing guidelines. This minimises lead leakage and builds trust from the first touchpoint.
To improve QA scores, implement these focused strategies:
- Develop a Weighted Scorecard: Create a rubric with clear, measurable criteria. Weight critical items like compliance and data security more heavily than politeness or grammar.
- Conduct Regular Calibration Sessions: Ensure all QA analysts and team leaders are scoring consistently by holding quarterly calibration meetings to review and align on specific call evaluations.
- Leverage Analytics for Systematic Review: Use conversation analytics tools to automatically flag interactions with potential QA issues (e.g., negative sentiment, long silences), allowing for a more targeted review process.
- Build a Best-Practice Library: Create a repository of high-scoring call recordings to use as a gold standard for agent training and coaching, demonstrating what excellence looks like in practice.
9. Compliance Rate
Compliance Rate is a non-negotiable quality parameter for BPO operations, especially in regulated industries. It measures the percentage of interactions that strictly adhere to all applicable legal, regulatory, and internal company policies. A high compliance rate is not just about quality; it's a fundamental pillar of risk management, protecting the organisation from severe financial penalties, legal action, and reputational damage.
For senior leadership, maintaining a near-perfect compliance rate is critical for business continuity and trust. A single compliance failure, such as a breach of data privacy regulations or a failure to provide a legally required disclosure, can have catastrophic consequences. This metric directly reflects an organisation's ability to operate responsibly and safeguard sensitive customer information, which is a cornerstone of brand integrity and customer loyalty.
How to Measure Compliance Rate and Industry Benchmarks
Compliance is typically measured through quality assurance audits of call recordings and screen captures. The formula is:
Compliance Rate (%) = (Number of Interactions Meeting All Compliance Requirements / Total Number of Interactions Audited) x 100
Audits focus on "critical failure" points, where a single mistake results in a 0% score for that interaction. The industry benchmark for compliance is universally high, often aiming for 99.5% to 100%, as anything less can introduce significant risk.
- BFSI: A 100% adherence is often the target for KYC verification, consent recording, and disclosure of terms.
- Healthcare: A benchmark of 100% is essential for HIPAA and PHI protection rules.
- Telecom: Aims for 99%+ on rules like verifying customer authorisation and documenting opt-in consent.
Real-World Impact and Improvement Strategies
High compliance isn't just a defensive measure; it builds customer trust. In healthcare, an AI voice agent like DialNexa can ensure every patient interaction includes the mandatory PHI protection disclosures and appointment confirmations, eliminating human error and guaranteeing adherence to HIPAA. Similarly, in BFSI, it can ensure 100% of calls complete the required KYC verification steps before proceeding, preventing fraud and meeting regulatory demands.
To achieve and maintain a high compliance rate, focus on these strategies:
- Implement Mandatory Conversation Elements: Use scripting or AI frameworks that require agents to complete specific compliance checks before an interaction can proceed.
- Leverage Compliance-Focused AI: Utilise AI tools like DialNexa that have pre-built, auditable compliance frameworks for sectors like financial services and healthcare.
- Conduct Regular Audits: Establish a routine audit process that samples and reviews recorded calls against a detailed compliance checklist.
- Provide Continuous Training: Use scenario-based training to educate agents on regulatory nuances and monitor regulatory changes to keep conversation frameworks updated.
10. Net Promoter Score (NPS)
Net Promoter Score (NPS) transcends traditional satisfaction metrics by measuring customer loyalty and their willingness to advocate for your brand. It gauges the likelihood of customers recommending your organisation to others, making it a powerful predictor of future revenue growth and brand health. A high NPS indicates that your service interactions, whether human-led or AI-driven, are creating genuine promoters who drive organic growth.
For C-suite executives, NPS is more than just a customer service metric; it’s a strategic indicator of long-term business viability. A positive NPS score signals that the BPO is not merely handling transactions but building valuable customer relationships. This directly impacts customer lifetime value, reduces churn, and lowers customer acquisition costs through positive word-of-mouth, solidifying the BPO’s role as a strategic growth partner.
How to Measure NPS and Industry Benchmarks
NPS is calculated based on a single question: “On a scale of 0-10, how likely are you to recommend our company/product/service to a friend or colleague?” Respondents are grouped as Promoters (9-10), Passives (7-8), and Detractors (0-6).
NPS = % of Promoters – % of Detractors
Surveys are typically deployed via email or SMS within 24 hours of an interaction. While a positive score is good, benchmarks vary significantly by sector.
- Software/SaaS: A score of 70+ is considered excellent, driven by responsive presales and smooth onboarding.
- Real Estate: Aim for 70+, reflecting expert property matching and seamless transaction support.
- EdTech: Targets a score of 65+, achieved through personalised programme guidance and positive student outcomes.
- BFSI: A score of 55+ is a strong benchmark, signifying knowledgeable and empathetic account assistance.
Real-World Impact and Improvement Strategies
High NPS translates directly into business momentum. An e-commerce brand that improves its customer service AI interactions can see its NPS jump from 35 to 60, resulting in increased repeat purchases and referrals. Similarly, a real estate firm achieving an NPS of 70+ builds a powerful network of advocates who bring in high-quality, pre-qualified leads at no additional cost.
To improve your NPS, focus on these actionable strategies:
- Segment Your Feedback: Analyse NPS scores by customer type, product line, or interaction channel to pinpoint specific areas of excellence and concern.
- Close the Loop with Detractors: Implement a process to follow up with every detractor. Understand their pain points and take visible action to resolve their issues, often turning them into loyal customers.
- Empower AI with Empathy: For voice AI like DialNexa, ensure conversation flows are designed not just for efficiency but also to convey understanding and empathy, creating a positive emotional connection.
- Celebrate and Learn from Promoters: Analyse interactions with promoters to identify what your team or AI is doing right. Codify these best practices and replicate them across all customer-facing processes.
10-Point BPO Quality Metrics Comparison
| Metric | 🔄 Implementation Complexity | ⚡ Resource Requirements | ⭐ Key Advantages | 📊 Expected Outcomes | 💡 Ideal Use Cases & Tip |
|---|---|---|---|---|---|
| First Call Resolution Rate (FCR) | Medium — needs end-to-end flows, KB, escalation rules | Moderate — training, analytics, conversation design | ⭐⭐⭐⭐ — fewer repeat contacts; higher trust and efficiency | Reduced operational costs; higher customer satisfaction; faster conversions | Real estate, EdTech, BFSI — design flows that anticipate objections |
| Connect Rate | Low–Medium — dialing tech + list hygiene; timing logic | Moderate — dialer, list cleansing, real‑time adaptivity | ⭐⭐⭐⭐ — greater reach; more live conversations | Increased lead volume; lower cost-per-qualified-lead | Outbound campaigns (EdTech, real estate) — use predictive dialing and time windows |
| Lead Quality Score | Medium–High — scoring models, criteria definition | Moderate — data, rules engine, analytics | ⭐⭐⭐⭐⭐ — consistent, high-accuracy qualification (97% benchmark) | Better routing; higher conversion efficiency; less manual review | Sales handoffs (BANT); set confidence thresholds and review false negatives |
| Average Handling Time (AHT) | Low–Medium — measurement + flow optimization | Low–Moderate — WFM, scripts, post-call automation | ⭐⭐⭐ — improves capacity when balanced with quality | Lower staffing needs; cost-per-contact reduction if quality preserved | High-volume BPOs — set realistic AHT per call type; automate post-call work |
| Customer Satisfaction Score (CSAT) | Low — survey setup and integration | Low — survey tool, QA sampling | ⭐⭐⭐⭐ — direct measure of experience and rapport | Insight into experience gaps; correlates with repeat business | Client-facing services (healthcare, EdTech) — send post-call survey within 15 minutes |
| Conversion Rate | Medium — attribution, multi-stage tracking | Moderate — analytics, coaching, follow-up sequences | ⭐⭐⭐⭐ — direct revenue impact (DialNexa shows 2%→8% improvements) | Higher revenue per lead; clear ROI on agent performance | Enrollment/sales campaigns — A/B test scripts; use real-time coaching |
| Schedule Adherence Rate | Low — WFM configuration and policies | Moderate — WFM software, monitoring dashboards | ⭐⭐⭐⭐ — predictable capacity; SLA reliability | Improved SLA compliance; better staffing forecasts | Large BPOs — target 90–95%; supplement with AI agents for overflow |
| Quality Assurance Score (QA Score) | High — rubric design, sampling, calibration | High — QA analysts, scoring tools, calibration sessions | ⭐⭐⭐⭐ — ensures compliance and consistent quality | Training insights; regulatory assurance; benchmarkable quality | Regulated sectors (BFSI, healthcare) — define clear rubric and quarterly calibration |
| Compliance Rate | High — legal mapping, mandatory elements, audit trails | High — legal review, monitoring, recording retention | ⭐⭐⭐⭐⭐ — mitigates regulatory risk; essential for regulated industries | Reduced fines and reputational risk; auditable interactions | BFSI/healthcare — implement mandatory conversation checkpoints and real‑time flags |
| Net Promoter Score (NPS) | Low — single-question survey process | Low — survey distribution, segmentation | ⭐⭐⭐⭐ — measures loyalty and referral propensity | Benchmarkable loyalty metric; predictive of growth | Brand/experience focus — follow up detractors and segment NPS by cohort |
From Metrics to Momentum: Activating Your Quality Framework
We have journeyed through the ten essential quality parameters for BPO, from foundational efficiency metrics like Average Handling Time (AHT) and Schedule Adherence to pivotal effectiveness indicators such as First Call Resolution (FCR) and Conversion Rate. We've dissected what each KPI means, how to measure it, and crucially, how to improve it. But simply tracking these numbers in isolation is like trying to navigate a complex city with ten different, disconnected maps. The true strategic advantage for any forward-thinking organisation lies in synthesising this data into a single, cohesive narrative of operational excellence and customer delight.
For a Director of Customer Experience in an e-commerce firm or a VP of Operations in a BFSI company, these metrics are not just about contact centre performance. They are direct inputs into your business's profitability, customer loyalty, and brand reputation. A high FCR is not just an agent-level success; it's a direct reduction in operational cost and a significant boost to customer retention. Similarly, a rising Net Promoter Score (NPS) is a leading indicator of future revenue growth and market share expansion. The modern BPO quality framework demands that leaders see this interconnectedness, realising that a dip in QA Scores will inevitably ripple outwards, impacting CSAT and, ultimately, the bottom line.
Moving from Data Points to Strategic Levers
The most critical takeaway is to view your quality framework as a system of levers, not a static report card. Each parameter, from Lead Quality Score to Compliance Rate, offers a control point to steer your business towards its strategic objectives. The challenge has always been the sheer scale and complexity of managing these levers in real time, especially with human-led teams where variability is a given.
This is where the paradigm shift occurs. By embracing advanced technologies like Voice AI, you can transform this complex system from a reactive, manual oversight process into a proactive, automated engine for excellence.
Key Insight: The future of BPO quality management is not about more dashboards or more human auditors. It is about embedding intelligence directly into your workflows to guide, correct, and optimise every single interaction as it happens, ensuring that every one of your quality parameters for BPO is consistently met.
Your Actionable Blueprint for Quality Transformation
Mastering these concepts moves your BPO operations from a cost centre to a strategic asset. It allows you to deliver on promises, build unwavering customer trust, and create a sustainable competitive advantage. So, where do you begin?
- Conduct a Holistic Audit: Review your current QA scorecard. Are you balancing efficiency metrics (like AHT) with experience metrics (like CSAT and NPS)? Identify which of the ten parameters are under-leveraged or missing entirely from your framework.
- Map Interdependencies: Create a simple flow chart that links these KPIs. For instance, how does a drop in Schedule Adherence impact AHT and, subsequently, customer wait times and CSAT? Visualising these connections is crucial for senior leadership to grasp the full picture.
- Identify Automation Hotspots: Pinpoint the areas where manual intervention is causing bottlenecks or inconsistencies. Is it in scoring agent calls for compliance? Is it in qualifying leads before they reach your sales team? These are prime opportunities for AI-driven automation to deliver immediate, measurable impact.
- Launch a Pilot Programme: You don't need to overhaul your entire operation overnight. Select a specific team or process-perhaps one struggling with a low Conversion Rate or high AHT-and introduce an AI-powered solution. Measure the before-and-after impact to build a powerful business case for wider implementation.
By adopting this strategic, technology-forward approach, you are not just monitoring quality; you are actively engineering it. You are building a resilient, intelligent, and highly efficient operation that can scale without sacrificing the personal touch that defines a great customer experience. This is how you convert metrics into unstoppable business momentum.
Are you ready to transform your quality framework from a reactive report into a proactive engine for growth? Discover how DialNexa leverages cutting-edge Voice AI to automate quality assurance, enhance agent performance, and drive unparalleled results across all critical BPO parameters. Visit DialNexa to see how we help businesses engineer excellence into every conversation.
[…] scores, average turnaround time, agent turnover rates, and compliance adherence percentages. First Call Resolution is vital for BPO success, with industry targets typically ranging from 70% to 85% depending on service […]