
Contact Centre KPI Guide for CXOs 2026
The most dangerous contact centre KPI is often the one the board celebrates.
A low Average Handle Time can look like discipline. In practice, it can signal rushed calls, weak verification, preventable repeat contacts, and avoidable escalation. That trade-off matters more now because Indian customer service has already moved beyond a voice-only world. Only 27% of Indian consumers say they use a call centre first, while 32% prefer live chat and 19% prefer email according to Wyn Enterprise's summary of contact centre KPI priorities. A centre can look efficient on phone dashboards while customers still experience friction across the wider journey.
That's why the old contact centre kpi playbook no longer works. For Indian leadership teams in BFSI, EdTech, Real Estate, SaaS, and e-commerce, the contact centre now shapes conversion, retention, compliance confidence, and brand trust. The right KPI system doesn't just measure activity. It tells you whether your operation is protecting revenue, reducing customer effort, and scaling intelligently across human and AI-assisted channels.
Table of Contents
- Why Your Contact Centre KPIs Are Probably Wrong
- The Foundational KPIs Every Leader Must Master
- Beyond Efficiency KPIs That Drive Strategic Growth
- KPI Benchmarks for Indian Industries
- How to Build Your Strategic Contact Centre Dashboard
- Optimising KPIs with Voice AI and Automation
- Critical KPI Pitfalls That Sabotage Performance
- Conclusion From Measurement to Strategic Management
Why Your Contact Centre KPIs Are Probably Wrong
Most KPI stacks still reflect an older operating model. They were built when contact centres were treated as scale engines for volume management, not as levers for loyalty, compliance, and growth.
That historical context matters in India. As customer experience operations expanded alongside the outsourcing industry, contact centre KPIs became strategically important. The classic triad of Service Level, First Contact Resolution, and CSAT became standard because call handling quality affected cost and brand trust in high-volume sectors, and by the mid-2010s the model had already shifted from pure call volume to measurable experience management, as outlined in this call centre KPI reference.
The problem is that many leadership teams stopped evolving the framework there. They still ask operations heads to drive down queue time, trim handle time, and improve staffing efficiency. Those metrics matter, but they don't answer the board's real questions. Are we resolving issues before they become churn risk? Are we protecting regulated journeys? Are we converting support interactions into trust, renewal, or next-best action?
Why legacy dashboards mislead executives
A legacy dashboard usually over-reports speed and under-reports business consequence.
That creates three distortions:
- Efficiency looks like effectiveness: A fast call isn't always a resolved call.
- Voice appears healthier than the full journey: A customer may finish the phone interaction only to restart on chat or email.
- Operational success gets detached from commercial outcomes: Teams hit internal targets while customer effort rises.
Board lens: If a KPI cannot show its effect on customer trust, repeat demand, risk control, or revenue protection, it belongs lower on the dashboard.
The strategic reset
A modern contact centre kpi framework should treat the centre as a decisioning layer inside the customer journey. In BFSI, that means resolution quality and compliance confidence. In EdTech, it means counselling continuity and conversion readiness. In Real Estate, it means lead qualification quality and follow-through.
The best operators don't abandon efficiency metrics. They subordinate them to strategic outcomes.
The Foundational KPIs Every Leader Must Master
A board cannot govern a contact centre with outcome metrics alone. It also needs a small set of operating KPIs that show whether demand is accessible, resolution is credible, and delivery quality is stable across channels.
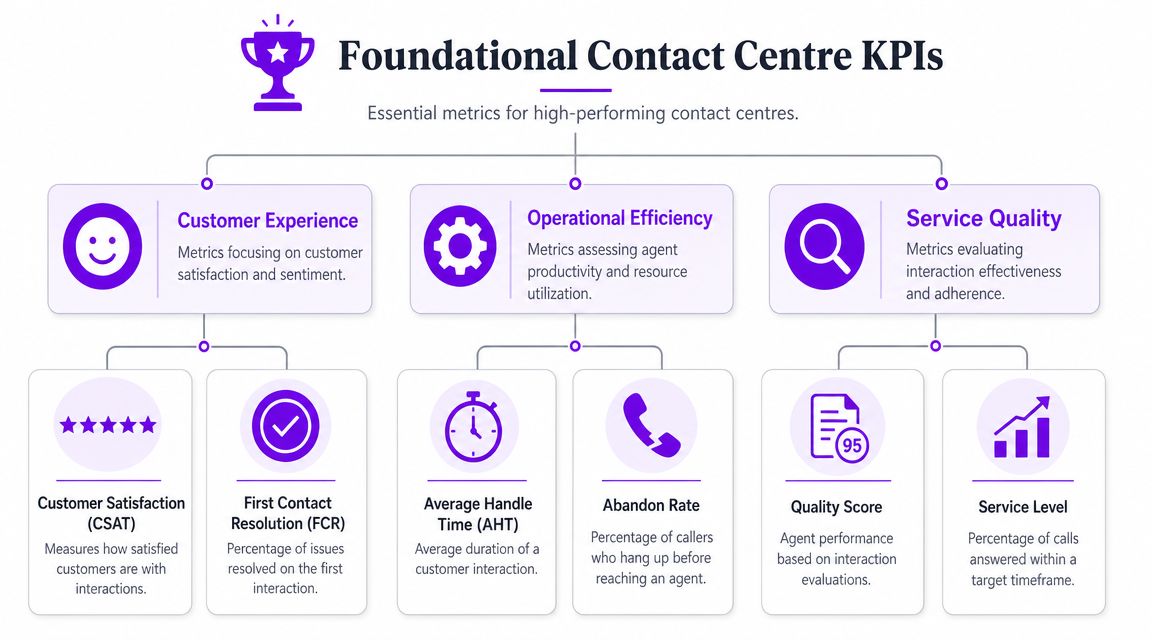
The five measures that anchor the dashboard
Start with First Contact Resolution (FCR). It is typically calculated as contacts resolved on the first interaction divided by total contacts. Among foundational KPIs, FCR comes closest to the board's core question: did the organisation remove customer effort, or did it defer it?
Next is Customer Satisfaction (CSAT). It is usually measured as positive survey responses divided by total responses, multiplied by 100. Used well, CSAT helps leaders test whether the interaction felt competent, fair, and easy. Used poorly, it becomes a post-call mood score. Teams reviewing survey design and interpretation can use this guide to CSAT measurement in customer support.
Then comes Service Level, the share of contacts answered within a defined threshold. Many operators still use 80/20 as a planning convention. The number itself matters less than the discipline behind it: a service level target should reflect customer tolerance, queue economics, and journey risk. In BFSI, delay can increase abandonment on regulated or high-anxiety interactions. In EdTech, delay can disrupt counselling momentum. In Real Estate, delay can reduce lead conversion because intent decays quickly.
Average Speed of Answer (ASA) adds a second access lens. Service Level shows threshold performance. ASA shows queue friction in elapsed time. When ASA rises while Service Level appears stable, leaders often find uneven interval staffing, poor forecasting, or priority rules that protect one queue by sacrificing another.
The fifth measure is Average Handle Time (AHT). The standard formula includes talk time, hold time, and after-call work, divided by total contacts handled. That detail matters because AHT is not a productivity score in isolation. It is a composite measure of process design, knowledge access, system latency, compliance burden, and agent skill.
Why the interpretation matters more than the formula
These KPIs create value only when they are read as a system.
| KPI | What it tells you | What can go wrong if isolated |
|---|---|---|
| FCR | Whether customer demand is being fully resolved | High FCR can mask poor disposition hygiene or weak resolution definitions |
| CSAT | How customers rated the interaction | High CSAT can coexist with repeat effort later in the journey |
| Service Level | Whether access meets the target threshold | Faster answer times can hide weak diagnosis or rushed conversations |
| ASA | Whether queue performance is under control | Lower ASA can be bought with excess staffing or channel imbalance |
| AHT | How much work each interaction requires | Lower AHT can come from cutting verification, empathy, or documentation |
The non-obvious point is that these metrics should diagnose trade-offs, not reward isolated wins.
Consider AHT. In an AI-augmented centre, a falling AHT can mean agent assist is reducing search time and summarisation effort. It can also mean agents are truncating issue discovery because targets are too aggressive. Those are opposite operating realities, and the same top-line KPI will hide both unless leaders break AHT into talk, hold, and after-call work, then segment by intent.
That segmentation is especially important in Indian sectors with uneven interaction complexity. A password reset, KYC correction, admissions counselling query, home-loan clarification, or site-visit qualification call should not sit in the same performance bucket. High-performing organisations benchmark these interaction types separately because they know that a single blended average distorts staffing decisions and masks failure points.
A practical board-level example makes the point. If a BFSI operation pushes shorter verification scripts to reduce handle time, AHT may improve within weeks. The downstream effect is often more repeat contacts, weaker audit confidence, and higher remediation cost. What looked like productivity was risk transfer.
Read AHT as a design signal. High hold time often points to poor knowledge retrieval or slow supervisor dependency. High after-call work often points to CRM friction, duplicate fields, or weak workflow automation. Long talk time on specific intents can indicate poor routing, weak scripts, or unresolved policy ambiguity.
For leaders, the question is not which foundational KPI matters most. The better question is which KPI movement changes a business outcome, and which secondary metric confirms that the improvement is real.
Beyond Efficiency KPIs That Drive Strategic Growth
A contact centre that reports only speed, cost, and volume will miss the metrics that determine revenue, retention, and risk. In an AI-augmented, omnichannel operation, strategic performance depends on whether the centre advances the customer journey, not whether it clears the queue faster.
As noted earlier, Indian customers already distribute their service demand across voice, chat, and email. The management implication is straightforward. A voice-heavy dashboard can no longer stand in for customer experience, and it is too narrow to guide capital allocation.
Measure journey progress, not queue closure
The strongest operators track whether an interaction moved the customer to the next valuable outcome. That outcome differs by sector. In BFSI, it may be compliant resolution without repeat verification. In EdTech, it may be progression from enquiry to counselling to enrolment. In Real Estate, it may be movement from first contact to qualified site visit to booking conversation.
That shift changes the KPI mix. The centre still needs operational control, but leadership also needs metrics that show whether service capacity is producing commercial and customer value.
Priority measures include:
- Channel containment rate: the share of interactions completed in the original channel without forcing the customer to switch
- Handoff rate: the share of cases transferred across teams, queues, or channels before completion
- Cross-channel repeat contact rate: the share of customers who return on another channel for the same issue
- Customer Effort Score: whether customers experienced the journey as easy or burdensome
- Intent completion rate: the share of interactions that achieved the customer's actual objective, not just an agent-side disposition code
- Conversion-assisted resolution rate: the share of service interactions that directly supported a commercial milestone such as application completion, document submission, site-visit confirmation, or renewal
These KPIs matter because friction rarely appears in one metric alone. A centre can post acceptable service levels while creating expensive failure elsewhere. High handoff rates often signal poor workflow design or fragmented ownership. Low channel containment usually points to weak self-service, poor bot-to-agent transitions, or systems that do not carry context across channels. High repeat contact after a nominal "resolution" often means the organisation measured closure rather than outcome.
The board should ask a harder question. Which interactions create measurable progress in the customer lifecycle, and which ones generate avoidable cost without resolving intent?
A few examples make the distinction clear. A BFSI contact centre can improve answer speed while increasing compliance exposure if customers must re-contact to complete KYC corrections. An EdTech support team can hit response targets while losing applicants during payment or document collection. A Real Estate team can respond quickly to new leads, yet still destroy conversion if site-visit scheduling, broker coordination, or follow-up is inconsistent.
Strategic KPIs change the investment case
Once leaders measure journey completion, customer effort, and commercial progression, the contact centre stops looking like a pure service overhead. It becomes easier to test whether AI routing, agent assist, workflow automation, or better CRM design is reducing avoidable demand and improving business outcomes.
That is the standard high-performing organisations use. They do not treat contact centre KPI design as an operations reporting exercise. They treat it as a control system for growth, retention, and risk.
KPI Benchmarks for Indian Industries
There is no universal “good” contact centre kpi score. Sector context changes the meaning of every number. A low handle time in one queue may indicate clarity. In another, it may indicate risk.
Use ranges and operating logic, not vanity targets
Because the verified evidence supports sector-specific interpretation rather than a single benchmark dataset, leadership teams should use benchmark bands and operating rules. The table below is a diagnostic template for Indian operations in 2026, not a claim of market-wide numeric averages.
| Metric | EdTech (Counselling/Support) | BFSI (Support/Compliance) | Real Estate (Lead Qual) | E-commerce (Post-Sale) | SaaS (Technical Support) |
|---|---|---|---|---|---|
| FCR | Target high for admissions, fee, and schedule queries. Segment counselling separately from support. | Prioritise compliant first-time resolution, especially where verification is required. | Use by intent. Qualification and booking should not be mixed with complaint handling. | Push high FCR for order, return, and delivery intents. | Treat FCR as a core quality gate, especially for product issues and account access. |
| AHT | Use separate bands for counselling and transactional support. | Use longer acceptable bands for verification-heavy and complaint-related calls. | Expect different bands for discovery, project fit, and site-visit coordination. | Decompose by order issue type, not by queue alone. | Segment by severity and product complexity. |
| CSAT | Read alongside conversion continuity and dropout points. | Read alongside escalation quality and repeat-contact risk. | Read alongside lead progression, not just courtesy scores. | Read with repeat-contact and fulfilment dependency. | Read with solution accuracy and customer effort. |
| ASA | Important during admission peaks. | Important, but not at the cost of verification quality. | Important for inbound lead capture where delay reduces momentum. | Important during delivery or returns spikes. | Important for urgent support queues, but less useful alone. |
| Abandonment Rate | Often signals poor staffing during campaign or result periods. | Can indicate high friction in peak complaint windows. | A missed lead may become a lost opportunity. | Often tied to surge periods and routing gaps. | Often points to triage design or poor queue segmentation. |
| Channel KPIs | Track handoff from chat or web forms into counselling teams. | Track leakage between self-service, assisted service, and complaint workflows. | Track lead-source to call outcome continuity. | Track movement between app, email, and phone. | Track channel containment and repeat contact across support channels. |
How each industry should interpret the dashboard
BFSI should resist simplistic pressure to reduce AHT. Compliance-heavy interactions naturally require more wrap-up and verification. Leadership should ask whether current handle times preserve documentation quality and reduce avoidable repeat demand.
EdTech should separate support from counselling. A student asking about a document deadline is not the same as a prospect evaluating programme fit. If both enter one KPI pool, managers optimise the wrong work.
Real Estate should treat qualification quality as a strategic measure. A short, friendly call is not useful if the team captures weak intent data and forces multiple follow-ups before booking.
SaaS teams should make FCR the anchor metric, then diagnose gaps through channel transfers and repeat contact patterns. Technical support quality compounds across retention, product trust, and expansion readiness.
Benchmarks become useful only when they reflect the economics of the queue, the risk profile of the interaction, and the complexity of the customer's intent.
How to Build Your Strategic Contact Centre Dashboard
Most dashboards fail because they try to show everything to everyone. A CXO doesn't need queue-level clutter. An operations manager does. The answer is tiered visibility.

A useful design principle is simple. Every KPI on the first screen should support one of three executive decisions: invest, intervene, or redesign. Anything else belongs in a drill-down view. For teams planning that architecture, these examples of contact centre dashboards for operations and leadership are a helpful starting point.
Build three layers of visibility
Layer one is the board view. It should show a compact set of strategic indicators such as resolution quality, customer satisfaction trend, customer effort trend, channel leakage, and cost per resolution. If the centre supports revenue workflows, add conversion-linked metrics such as qualified follow-up progression or assisted sales contribution.
Layer two is the executive operating view. Leaders inspect FCR by queue, AHT by intent, abandonment by time band, and channel transfer patterns. It should answer why the top-line result moved.
Layer three is the manager's control panel. Include schedule adherence, queue health, QA trends, wrap-up time, and routing exceptions. This layer is for action inside the week, not board reporting.
A concise layout might look like this:
| Dashboard layer | Primary audience | Main question |
|---|---|---|
| Board | CEO, COO, CXO, BU heads | Is the contact centre protecting growth and trust? |
| Executive operations | VP CX, Director Support, Head of Service | Which levers are moving outcomes? |
| Team management | Ops managers, QA, WFM | What needs fixing today? |
What a board-ready view should show
Strong dashboards tell a causal story. If abandonment rises, did service level fall because staffing missed peak demand, or because a digital queue leaked into voice? If CSAT falls, was the issue resolution quality, long hold time, or broken handoff after the interaction?
This walkthrough captures the difference between activity dashboards and decision dashboards:
Practical rules help.
- Show relationships, not isolated numbers: Pair AHT with FCR and repeat-contact signals.
- Segment by intent class: Billing, KYC, complaint, onboarding, and technical troubleshooting should never be blended into one average.
- Separate voice from omnichannel continuity: A voice metric should not stand in for customer journey success.
- Flag management thresholds clearly: Leaders should see where intervention is required without reading the whole dashboard.
A dashboard becomes strategic when it reduces argument and increases response speed.
Optimising KPIs with Voice AI and Automation
Most KPI frameworks still assume that all meaningful work happens in human-handled voice interactions. That assumption is already outdated. A major gap in common KPI guidance is the lack of direction on AI-assisted work, even as India's AI market expands rapidly and enterprises increase AI deployment across customer operations, as discussed in ACXPA's analysis of call centre metrics.
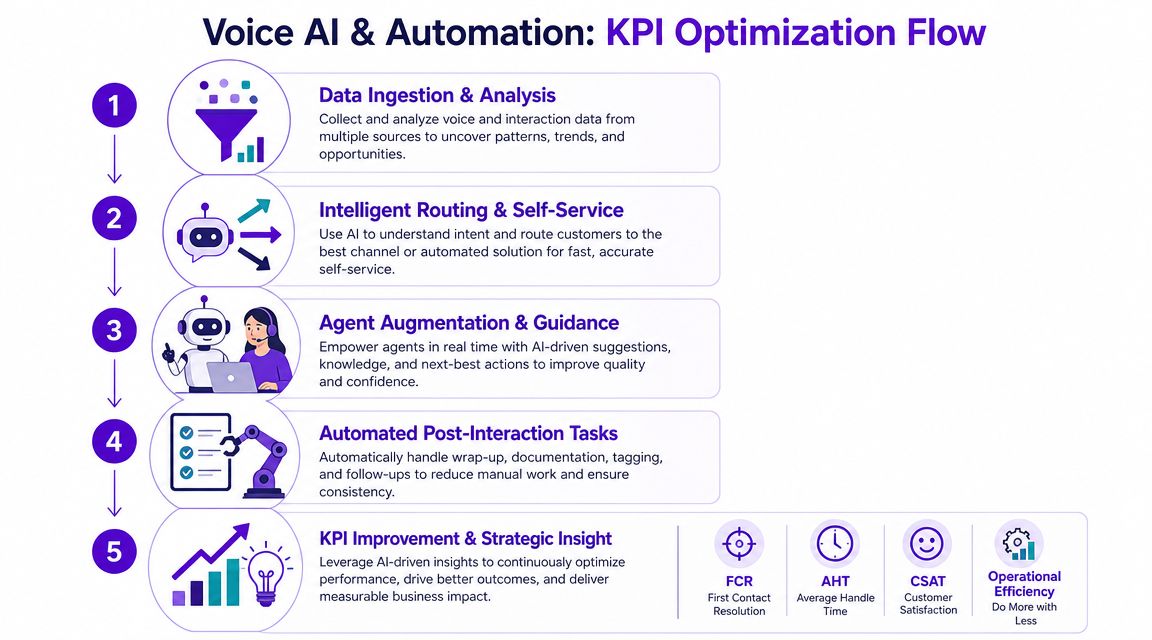
Where AI changes the KPI model
The first shift is measurement. Once AI enters the workflow, classic voice metrics stop being enough. You need additional measures such as containment rate, channel leakage, escalation quality, and AI-assisted resolution quality.
That changes operating design in three ways:
- Self-service becomes measurable work: If an AI agent resolves an intent without human intervention, that should count as successful service delivery, not invisible deflection.
- Escalation quality matters as much as escalation rate: A transfer is not failure if the AI captures context, intent, and next action cleanly.
- Post-contact work becomes an automation opportunity: Summary generation, tagging, and CRM updates can reduce wrap-up load without pressuring agents to rush customers.
A practical example is common in Real Estate. An AI voice agent can handle discovery questions, collect property preferences, qualify budget, and route only sales-ready leads to human teams. The KPI value is not just lower agent load. It is better consistency in qualification and cleaner routing into the next commercial step.
The same pattern applies in EdTech. AI can handle routine questions on schedules, eligibility guidance, or application status, while counsellors focus on nuanced conversations that influence enrolment decisions.
A practical operating model for blended teams
A modern blended centre should track four KPI groups.
- Access metrics such as response speed, abandonment, and blocked calls.
- Resolution metrics such as FCR, repeat-contact signals, and QA.
- Digital continuity metrics such as handoff rate and channel containment.
- Automation metrics such as containment, leakage, and assisted resolution quality.
For leadership teams exploring operating design, these strategies for scalable customer service provide a useful lens on where automation changes workload structure. Teams also need channel-specific execution detail. This guide to voice AI in Indian call centres is one practical reference for thinking through deployment and KPI implications. Another toolset in the market is DialNexa, which provides Voice AI agents for workflows such as qualification, support, recruitment, and presales, along with dashboards that can support KPI tracking in blended environments.
The right question is no longer whether AI reduces workload. It is whether AI improves resolution quality while preserving a coherent customer journey.
That is the benchmark that matters to a board.
Critical KPI Pitfalls That Sabotage Performance
The most common KPI failure is not under-measurement. It is false confidence.
The AHT trap is bigger than it looks
Low AHT is widely praised, but that praise often strips out context. In regulated Indian sectors such as BFSI, the more relevant question is not how low AHT can go, but what range preserves compliance and reduces repeat calls. Over-optimised AHT can hide poor first-contact resolution and compliance risk, as argued in Dialpad's review of call centre KPIs.
That matters because a neat efficiency story can conceal operational fragility. If agents skip clarifying questions, shorten disclosures, or compress documentation effort, the queue may move faster while downstream risk grows.
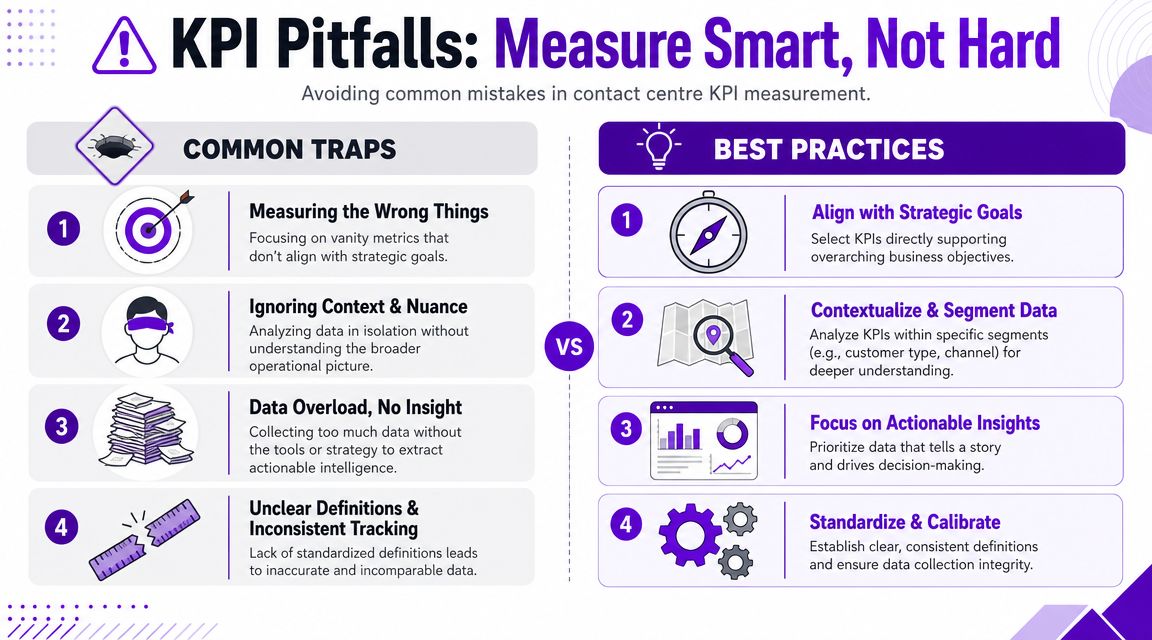
Four failure modes boards often miss
- Metric gaming: Agents learn what is measured and adapt behaviour to score well. If handle time dominates incentives, some will push customers off the line rather than solve the issue properly.
- Definition drift: Two managers may use different definitions of FCR, transfer, or repeat contact. Once that happens, trend lines stop being comparable.
- Cross-channel blindness: Voice dashboards can hide unresolved digital friction. A customer who retries on email after a call may disappear from the phone team's success story.
- Benchmark literalism: Teams treat targets as universal truths instead of context-driven ranges. That is especially dangerous when sectors have different risk and complexity profiles.
A simple governance checklist helps prevent this:
| Risk | What to do |
|---|---|
| Loose KPI definitions | Standardise formulas and reporting rules |
| Channel silos | Link voice, chat, and email journeys in one view |
| Incentives misaligned with outcomes | Reward quality and resolution, not speed alone |
| Poor data capture | Improve transcripts, tags, and disposition quality |
Accurate measurement also depends on better conversation data. Teams refining QA, compliance review, and intent tagging often benefit from understanding the basics of automatic speech to text systems, because transcription quality directly affects analysis quality.
A KPI system should make it harder to hide poor customer outcomes, not easier.
That is the difference between reporting and management.
Conclusion From Measurement to Strategic Management
A mature contact centre kpi model does more than report operational health. It helps leadership decide where to allocate effort, which journeys to redesign, and where automation can improve both service and economics.
The shift is conceptual as much as technical. Foundational metrics still matter, but they should sit inside a wider system that reflects omnichannel behaviour, intent complexity, compliance needs, and AI-assisted work. Once that happens, the contact centre stops being judged only on cost control. It starts being managed as an engine for trust, retention, and commercial progression.
The organisations that lead over the next cycle won't be the ones with the shortest calls. They'll be the ones with the clearest resolution logic, the strongest journey continuity, and the smartest blend of human and automated service.
If you're rethinking how your organisation measures and scales customer conversations, DialNexa Labs Private Limited is worth evaluating. The company builds Voice AI agents for qualification, support, presales, and recruitment workflows, with dashboards and deployment options suited to teams that want tighter control over modern contact centre KPIs across human and AI-assisted journeys.
[…] If your operations team needs a sharper measurement baseline, align these metrics with a structured contact centre KPI framework. […]
[…] refining these dashboards often adapt proven contact centre KPI structures so finance, operations, and service leaders are using the same […]
[…] directors formalising service governance, this contact centre KPI guide is a practical companion to build reporting discipline across […]
This is an excellent perspective on moving beyond outdated contact center metrics and aligning KPIs with real business outcomes. The emphasis on customer effort, resolution quality, and AI-driven optimization offers a much more strategic framework for modern CX leaders.
[…] model as revenue, cost-to-serve, and retention metrics. A useful reference point is this broader contact centre KPI framework for operational governance, which helps connect workforce decisions to enterprise performance rather than treating them as […]
[…] executives a cleaner basis for KPI oversight. If you're refining leadership reporting, these contact centre KPI benchmarks and frameworks are useful for aligning service metrics with business outcomes rather than isolated queue […]