Mastering E Reporting and Sales Analysis for Executive Growth
In the world of business leadership, data is your most valuable asset. But raw data is just noise; its real power is unlocked when you translate it into smart, revenue-driving decisions. This is where a solid e-reporting and sales analysis framework comes in, turning your historical data from a simple rearview mirror into a powerful predictive engine.
Translating Raw Data Into Revenue

Relying on gut instinct alone in today's market is a recipe for being left behind. What separates market leaders from the pack is their ability to make quick, confident decisions backed by hard evidence. That’s why e-reporting and sales analysis has moved out of the IT department and into the boardroom. In fact, research shows that data-driven organisations are 23 times more likely to acquire customers and 19 times more likely to be profitable.
Let's use a Formula 1 race to understand how this works for a C-suite executive.
-
E-reporting is like the live data streaming from the car to the pit crew. It's your real-time dashboard showing vital stats: sales velocity, pipeline health, and how quickly your team is responding to leads. It tells you exactly how fast you're going and where you are in the race right now.
-
Sales analysis is what the engineers do after the race. They dive deep into that data to figure out why the car gained a few milliseconds on a straight or lost time on a specific turn. It's about understanding the performance behind the numbers.
When you combine real-time monitoring with this kind of deep-dive investigation, you get a complete picture. You can react to immediate opportunities while building a strategy that gives you a long-term edge.
The Strategic Value for Leadership
For a VP of Sales or a Chief Revenue Officer, this is about much more than just pulling reports. It’s about having the ability to answer critical business questions with complete certainty, turning vague problems into clear, actionable insights. You can instantly spot what's not working and put more resources behind what is.
A sophisticated reporting framework gives leadership the key to unlocking market agility and predictable growth. It turns sales from an art form into a science, enabling forecasting accuracy that drives confident resource allocation and strategic planning.
Consider this practical example: a standard report shows a sudden 15% drop in lead conversion in a key territory. That number is alarming, but it doesn't tell a Director of Sales why. A proper sales analysis, however, could reveal that a new competitor just launched a highly targeted ad campaign in that area, resulting in a 30% increase in competitor mentions on sales calls.
This level of detail allows for a precise, surgical response—like a targeted counter-marketing campaign or specific sales training—instead of a panicked, company-wide reaction. At its core, this framework is all about giving you complete control over your revenue engine.
Pinpointing the KPIs and Data Sources That Actually Drive Decisions
Great leadership isn't about tracking every metric under the sun. It's about zeroing in on the vital few that have a direct line to revenue and growth. A smart e reporting and sales analysis strategy begins here: identifying the right Key Performance Indicators (KPIs) and knowing exactly where to find the data that feeds them.
Get this wrong, and you'll find yourself drowning in a sea of vanity metrics—numbers that look impressive on a slide deck but offer zero strategic value.
Think of your business as having four core engines. To keep things running at peak performance, you need to be watching the specific gauges for each one. This mindset shifts you from being a data collector to a data-driven decision-maker.
Customer Acquisition Metrics
This is the engine that brings new business through your front door. The goal isn’t just to measure the volume of new leads, but to understand the efficiency and cost of your efforts. Companies that get this right see a significant return; those with a defined lead management process, for instance, often achieve a 10% or greater revenue bump in just six to nine months.
- Lead Conversion Rate: Put simply, what percentage of your leads become paying customers? A company might generate 1,000 marketing qualified leads (MQLs) and convert 50 into paying customers, resulting in a 5% MQL-to-customer conversion rate. This metric, pulled from your CRM (think Salesforce or HubSpot), tells you how good your sales team is at sealing the deal. If this number is low, it could point to a need for better sales training or a disconnect between what marketing promises and what sales delivers.
- Customer Acquisition Cost (CAC): This is the bottom-line cost to get a new customer. You calculate it by dividing your total sales and marketing spend by the number of new customers you brought in. For example, if you spend $500,000 on sales and marketing in a quarter and acquire 500 new customers, your CAC is $1,000. Pulling data from your accounting software and marketing platforms, a high CAC is a serious warning sign that your growth model might be unprofitable.
Customer Retention and Value
It’s an old saying because it’s true: acquiring a new customer can cost five times more than keeping an existing one. This engine is all about maximising the long-term value of the people who already buy from you, turning them from one-time purchasers into loyal advocates.
The real goldmine in your business isn't just in the next sale; it's in the unfiltered feedback from your current customers. Analysing their direct words through call transcripts provides a qualitative depth that a purely quantitative report can never hope to capture.
- Customer Lifetime Value (CLV): This KPI forecasts the total revenue you can realistically expect from a single customer over their entire relationship with you. A SaaS company with a $100/month subscription and an average customer lifespan of 36 months would have a CLV of $3,600. It requires a blend of data from your CRM and billing systems. When your CLV is on the rise, it’s a strong signal that your products and services are delivering lasting value.
- Churn Rate: What percentage of customers stopped doing business with you over a given period? If you start a quarter with 1,000 customers and lose 50, your quarterly churn rate is 5%. This data is usually pulled from your subscription management platform or CRM. A high churn rate is a major red flag, pointing to deep-seated problems with your product, pricing, or customer experience.
Sales Performance and Operational Efficiency
These metrics get into the nitty-gritty of your sales cycle's health and speed. Even small improvements in operational efficiency can have a massive impact on the bottom line. For example, companies that respond to a new lead within an hour are nearly seven times more likely to have a meaningful conversation with a decision-maker.
- Average Deal Size: Tracked right in your CRM, this number is essential for accurate sales forecasting and figuring out where to put your resources. If your team closes 20 deals for a total of $200,000, your average deal size is $10,000. If it starts to shrink, it might be time to review your pricing strategy or look for better upselling opportunities.
- Sales Cycle Length: This is the average time it takes to close a deal, from that very first contact to the final signature. A long sales cycle (e.g., 90+ days for a B2B SaaS product) can drain resources and often signals friction somewhere in your sales process. You can dig deeper into optimising your funnel with our guide to bounce and exit rate analytics to increase conversions.
- Lead Response Time: How quickly does your team follow up with an inbound lead? Reducing this from 24 hours to under 5 minutes can increase lead conversion rates by up to 900%. This is a critical operational KPI, often tracked with sales engagement platforms and Voice AI systems like DialNexa, which give you timestamped, undeniable data on every single interaction.
Mapping Strategic KPIs to Essential Data Sources
To tie it all together, leaders need a clear map showing which metrics answer their most pressing strategic questions and where that information lives. Without this clarity, teams end up chasing disconnected data points instead of focusing on what moves the business forward.
The table below breaks down how key performance indicators, sourced from specific business systems, provide the high-level insights that C-suite executives need to steer the company.
| KPI Category | Example KPI | Primary Data Sources | Strategic Insight For CXOs |
|---|---|---|---|
| Customer Acquisition | Customer Acquisition Cost (CAC) | CRM, Marketing Automation, Accounting Software | "Are we spending our growth capital efficiently, or is our path to scale unprofitable?" |
| Customer Retention | Customer Lifetime Value (CLV) | CRM, Billing Systems, E-commerce Platforms | "Are we building a sustainable business with a loyal customer base, or a leaky bucket?" |
| Sales Performance | Sales Cycle Length | CRM, Sales Engagement Platforms (e.g., Outreach) | "Where are the bottlenecks in our revenue engine, and how can we accelerate cash flow?" |
| Operational Efficiency | Lead Response Time | Voice AI (e.g., DialNexa), CRM, Call Centre Software | "Is our team structured for speed and effectiveness, or are we letting opportunities slip away?" |
This framework isn't just about reporting; it's about creating a direct line of sight from daily operations to top-level business strategy.
Ultimately, the most powerful insights emerge when you blend these hard numbers with real human context. Your CRM might log a deal as "lost," but analysing the call transcripts could reveal the prospect mentioned a competitor's lower price three separate times. That's the kind of actionable intelligence your standard reports will always miss. Fusing these data sources is the true foundation of strategic sales analysis.
Using Modern Tools for Advanced Sales Analysis
Moving from reactive reporting to proactive forecasting is what separates a good sales organisation from a great one. Basic reports tell you what happened last quarter. Advanced sales analysis, on the other hand, tells you what’s likely to happen next—and more importantly, what you should do about it. This is where modern analytical methods and tools become absolutely critical for leadership.
The goal is to stop driving your business by looking in the rearview mirror. Instead, you can use data to light up the road ahead, spotting both opportunities and potential roadblocks before they even appear. That’s how you build a truly predictive sales engine.
From Data Points to Strategic Foresight
Thankfully, sophisticated analysis techniques are no longer locked away in the data science department. Today’s Business Intelligence (BI) platforms put immense power directly into the hands of business leaders, turning complex statistical models into clear, actionable visualisations.
Two methods, in particular, can have an immediate impact on your sales strategy:
- Regression Analysis: Think of this as your financial crystal ball. By looking at historical data—things like past sales figures, marketing spend, and even seasonal trends—it can predict future revenue with surprising accuracy. For a sales leader, this means setting more reliable targets and allocating budgets with confidence, shifting from educated guesses to data-backed financial planning. For example, an analysis might predict that every $10,000 in additional ad spend correlates to a $45,000 increase in quarterly sales.
- Funnel Analysis: This gives you a microscopic, stage-by-stage view of your sales process. It pinpoints exactly where your most valuable deals are getting stuck or dropping off. You might find that 60% of leads drop off after the initial demo but only 10% drop off during contract negotiations, indicating a clear issue with the demo's value proposition.
These methods are designed to find the hidden friction in your revenue engine. This allows for precise, targeted fixes instead of broad, inefficient overhauls. If you're curious about how these models work their magic, our gentle introduction to SHAP for tree-based models breaks down how we can interpret their predictions.
The Modern Business Intelligence Toolkit
The real power of modern e-reporting and sales analysis comes from the accessibility of tools like Tableau and Microsoft Power BI. These platforms can connect to all your different data sources—your CRM, marketing automation system, accounting software—and pull everything together into a single, interactive dashboard.
For a modern executive, a BI dashboard isn't just a reporting tool; it's a command centre. It lets you zoom from a 30,000-foot strategic overview down to ground-level operational details in seconds, collapsing the time between insight and action.
These tools empower leaders who aren't data scientists to ask and answer complex business questions without needing to file a ticket with the IT team. They make exploring data intuitive, which helps build a culture of curiosity and evidence-based decisions throughout the entire company. The result is a massive competitive advantage.
A Practical Scenario in Action
Let’s see how this plays out in the real world. Imagine a VP of Sales starting her day by looking at a national sales dashboard in Power BI. The top-line numbers show a worrying 5% dip in total revenue month-over-month.
-
Initial Drill-Down: With a single click on the national map, she filters the data by region. She instantly sees that the North-East region is underperforming by 12%, while every other region is hitting its targets.
-
Product-Level Investigation: She then clicks on the North-East region to filter further, this time by product line. The dashboard reveals that one specific, high-margin product is responsible for 80% of the regional shortfall.
-
Team Performance Analysis: Finally, she isolates that product and drills down to the sales team level. The data clearly shows one particular team's sales for that product have plummeted by 40%, while other teams in the same region are performing just fine.
In less than five minutes, she has gone from a vague, company-wide problem ("sales are down") to a highly specific, actionable insight: one team in one region is struggling to sell one particular product. This immediately points to a targeted training gap, not a national crisis. She can now schedule a focused coaching session, armed with precise data, to tackle the root cause directly. This is the speed and precision that modern sales analysis provides.
Integrating Voice AI Data for a Competitive Edge in Reporting
Your standard sales reports are great at telling you what happened. They show the numbers, the pipeline movement, and the final outcomes. But if you want a real competitive advantage, you need to understand why it happened. This is where bringing voice AI data into your e-reporting and sales analysis completely changes the game.
Think about it. Your CRM might show a deal was lost to ‘No Decision,’ but that tells you almost nothing. Voice data, on the other hand, pulls back the curtain on the actual conversation. It reveals the hesitation in a prospect's voice, the specific product features they kept asking about, and which competitor they mentioned three times.
This is all about turning unstructured, messy conversation data into a clean, strategic asset. Voice AI platforms like DialNexa can listen to and analyse thousands of customer calls, automatically flagging things like customer sentiment, key topics, objections, and buying signals. This structured goldmine of information then flows right into your BI tools, enriching your reports with insights that come straight from the customer's mouth.
Unlocking the 'Why' Behind the 'What'
Let’s imagine a common headache for a sales director. You’re looking at your dashboard and see a 10% drop in conversion rates for what should be a hot lead segment. The numbers are setting off alarm bells, but they aren't telling you how to fix the problem.
Now, let's add voice AI analysis to the mix. The system flags that within this exact segment, mentions of "competitor pricing" have shot up by 40% over the last month. Instantly, you have a clear, actionable insight. The issue isn't your team's performance; it's a new pressure in the market. You can now respond strategically, perhaps by refining your value proposition or arming your team with better negotiation tactics.
Integrating voice AI closes the gap between the numbers you see and the context you need. It lets your leadership team stop just reacting to metrics and start proactively solving the root causes of customer behaviour.
And this isn't just theory; this level of insight is incredibly reliable. For instance, DialNexa has shown a 97% accuracy rate when its AI-qualified leads are compared against the judgment of human sales experts. It proves the technology can be trusted to spot real opportunities at scale. If you're curious about the mechanics, you can learn more about how AI voice agents are transforming customer service and sales in our detailed guide.
This chart shows how raw data gets turned into smart, strategic action in a modern sales analysis process.
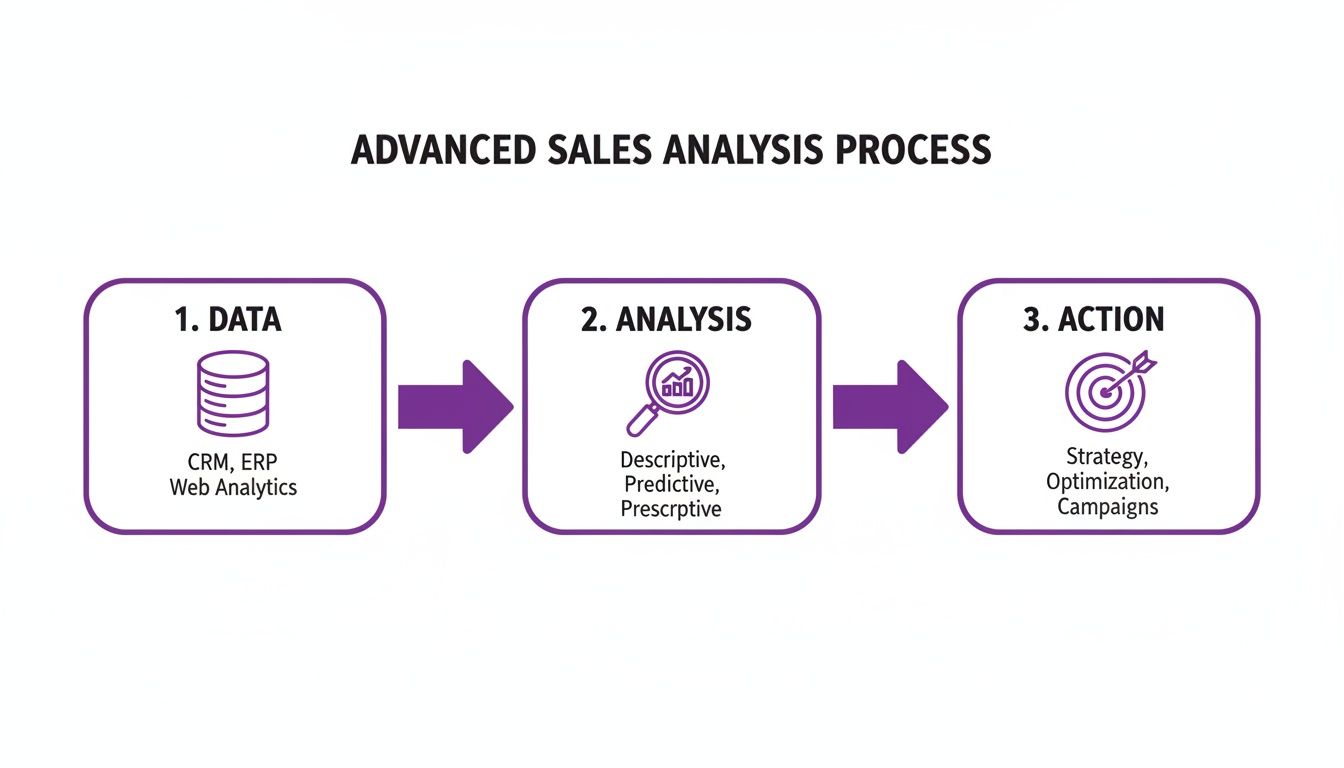
The flow from data collection to analysis and, finally, to targeted action really drives home why having a structured approach is so critical for getting meaningful results.
Practical Application: A Mini Case Study
Let's look at a real-world example from the EdTech industry. An online learning company had a healthy stream of leads coming in from a big marketing campaign, but the conversion rate was frustratingly low. Their standard reports offered no clues as to why.
So, they used voice AI to analyse the sales calls with these specific leads. A crucial pattern quickly emerged. In almost 40% of the conversations, potential students were getting confused about a particular advanced module in the company's flagship course. This confusion was creating a major roadblock, causing them to hesitate and delay enrolment.
With this specific insight in hand, the company took immediate, focused action:
- Website Update: They redesigned the course landing page, adding a clear explainer video and a detailed FAQ section to tackle the confusion around that module head-on.
- Sales Script Adjustment: They tweaked the sales team's script to proactively explain the module's benefits and structure early in the call.
The impact was fast and clear. Within two months of these data-driven changes, the company saw a 15% lift in conversions from that campaign. They didn't get there by guessing. They got there by listening to the voice of their customers at scale and plugging that intelligence directly into their sales and marketing strategy. That’s the real, tangible power of enriched e-reporting.
Tailoring Your Reporting Blueprint for Industry Success
A generic reporting strategy will only ever get you generic results. To really spark growth, your leadership team needs an e-reporting and sales analysis framework built specifically for your industry. After all, a metric that’s gold for an EdTech company might be completely useless to a real estate firm.
When you customise your blueprints, you turn raw data into a genuine competitive edge. It lets your executives zero in on the KPIs that actually move the needle on revenue and market share. This isn't about creating a one-size-fits-all dashboard; it's about building a command centre for sharp, strategic decisions.
Let's look at how this plays out in four key sectors.
H3: EdTech: Optimising the Enrolment Funnel
In the world of EdTech, the journey from a curious inquiry to a confirmed enrolment is everything. The real focus here is on sales velocity and just how effective your academic counsellors are at guiding prospective students through the process.
- Lead-to-Enrolment Rate: This is your north star. It tracks the percentage of qualified leads who actually become paying students. If this number is low, it’s a red flag that something’s off in your counselling process or that your marketing message isn’t quite aligning with what the programme delivers.
- Counsellor Productivity: This goes deeper than just call volume. It’s about measuring a counsellor's true impact with metrics like the demo-to-enrolment ratio or the average revenue they generate. A 10% increase here can directly lead to bigger, healthier cohorts.
- Funnel Velocity: How long does it take for a lead to move from one stage to the next? This KPI tells you exactly that. If things are slowing down, you can pinpoint the bottlenecks where leads are either losing interest or hitting a wall.
H3: Real Estate: Agent Performance and Lead Quality
Success in real estate boils down to two simple things: the quality of the leads coming in and how quickly and persistently your agents follow up. Your reporting blueprint has to give you a crystal-clear picture of which lead sources are worth the investment and how well your agents are turning those calls into site visits and bookings.
A standard report might tell you that you got 1,000 new leads. But a properly tailored real estate dashboard will show you that 90% of your most valuable leads came from just two sources. That’s the kind of insight that lets a Director of Sales reallocate their marketing budget with absolute confidence.
- Lead Source Effectiveness: This is where you track conversion rates from different channels, whether it's Zillow, MagicBricks, or inquiries from your own website. The ultimate goal is to figure out your Cost Per Site Visit for each channel.
- Agent Follow-up Cadence: Here, you’re measuring things like how long it takes an agent to respond to a new lead and how many contact attempts they make in the first 48 hours. A slow response can cause lead decay of up to 40%—a massive missed opportunity.
- Lead-to-Site-Visit Ratio: This KPI tracks the percentage of qualified leads who actually book and show up for a property viewing. It’s a direct indicator of both agent performance and the quality of your leads.
H3: E-commerce: Nailing Mobile-First Revenue Growth
Today’s e-commerce battlefield is fought on mobile. In India, for instance, smartphones were behind a staggering 82.3% of all online retail sales in 2023, with 81% of shoppers using their phones to make purchases. This means brands have no choice but to obsess over mobile-centric metrics, because even the slightest friction in that experience can kill your revenue. You can discover more insights on mobile commerce trends in India.
- Mobile Cart Abandonment Rate: Don’t just look at the overall number. Dig into this metric by device type and operating system. You’ll often uncover technical glitches or UX flaws that are only affecting your mobile customers.
- Promotion Impact on CLV: It’s easy to measure the immediate ROI of a campaign, but smart brands look at the bigger picture. This metric assesses how promotions (like a "Diwali Sale") affect long-term Customer Lifetime Value, making sure you’re not just attracting one-off bargain hunters.
- Device-Specific Conversion Rates: How well does your mobile app convert compared to your mobile website and your desktop site? This KPI shows you exactly where to invest your user experience budget for the biggest returns.
H3: BFSI: Balancing Compliance and Cross-Sell Mastery
For anyone in Banking, Financial Services, and Insurance (BFSI), reporting is a delicate balancing act. You have to chase aggressive growth targets while staying on the right side of very strict regulations. A solid blueprint, therefore, has to track both sales effectiveness and adherence to critical processes like customer verification.
- KYC Completion Rate: This compliance-focused metric tracks the percentage of new customers who successfully finish the Know Your Customer verification. A low rate can point to friction in your onboarding process, which leads to high drop-off rates and potential regulatory headaches.
- Cross-Sell/Up-Sell Ratio: Once you have a customer, how good is your team at offering them more? This measures their success in promoting other products—like offering insurance to a loan holder or a credit card to someone with a savings account.
- Customer Onboarding Time: From the moment someone applies to when they are fully up and running, how long does it take? A lengthy, drawn-out process is a sure-fire way to frustrate new customers and lose them before you’ve even started.
Sector-Specific Reporting Blueprints
To drive meaningful change, leadership needs a reporting framework that speaks their industry's language. The table below outlines how different sectors can focus their efforts on what truly matters for them.
| Industry | Top 3 KPIs | Primary Tools | Key Strategic Goal |
|---|---|---|---|
| EdTech | Lead-to-Enrolment Rate, Counsellor Productivity, Funnel Velocity | CRM, Voice AI (e.g., DialNexa), LMS | Maximise cohort sizes and accelerate the student acquisition cycle. |
| Real Estate | Lead Source Effectiveness, Agent Follow-up Cadence, Lead-to-Site-Visit Ratio | CRM, Property Portals, Call Tracking Software | Increase property viewings by optimising marketing spend and agent activity. |
| E-commerce | Mobile Cart Abandonment, Promotion Impact on CLV, Device-Specific Conversion | Analytics Platforms, E-commerce Platforms | Boost mobile revenue by perfecting the user journey and maximising customer value. |
| BFSI | KYC Completion Rate, Cross-Sell/Up-Sell Ratio, Onboarding Time | CRM, Core Banking Systems, Compliance Software | Drive profitable growth while ensuring seamless and compliant customer onboarding. |
By adopting these tailored blueprints, you move from simply collecting data to actively using it to outmanoeuvre the competition and hit your most ambitious targets.
Building a Data-Driven Sales Organisation
Even the most brilliant strategy for e-reporting and sales analysis will fall flat without proper execution. Moving from a great idea to a daily reality requires a practical roadmap that leadership can get behind. This isn't just about the tech; it's about weaving a data-first mindset into the DNA of your sales team.
The first, most crucial step is securing executive buy-in. Forget asking for new software. Instead, you need to build a rock-solid business case that speaks their language: return on investment. Frame the initiative in terms of tangible outcomes, like reducing customer acquisition costs by 10% or speeding up the sales cycle by 15% in the next two quarters.
With leadership on board, the real work begins.
Assembling Your Core Implementation Team
This kind of change can't be driven by one department working in isolation. A siloed approach is a recipe for failure. Real success comes from building a cross-functional team where everyone shares the same goals and knows their role.
Your core team absolutely must include people from:
- Sales Leadership: They’re on the front lines. They need to ensure the final reporting framework actually helps them answer their most pressing questions and manage their teams effectively.
- Marketing Operations: They are essential for connecting the dots between marketing campaigns, lead sources, and actual revenue. This is how you finally close the loop on marketing ROI.
- IT and Data Teams: These are the architects. They handle the technical heavy lifting, ensuring all your systems talk to each other and that the data flowing through them is clean, secure, and reliable.
This collaborative setup is your best defence against creating dashboards that look pretty but offer zero practical value to the people who need them most.
Executing the Strategic Rollout
Once you have the right people around the table, you can push forward with a structured plan. The objective is simple: build a system that delivers reliable insights your team can act on, week in and week out.
"The goal is to turn data into information, and information into insight. True competitive advantage comes not from having data, but from making it accessible and actionable for every single person on your team."
A phased rollout is the smartest way to go. It allows you to build momentum and minimise disruption by making sure each step is solid before moving to the next.
- Audit and Identify Gaps: Start by taking stock of your current data. Where does your most important information live? Even more critically, what are you missing? For most companies, the biggest blind spot is qualitative voice data—the rich context and nuance from actual customer conversations.
- Select an Integrated Tech Stack: Your tools need to play nicely together. A modern setup usually includes a core CRM, a Voice AI platform like DialNexa, and a capable Business Intelligence (BI) tool. An integrated stack demolishes data silos and gives everyone a single source of truth to work from.
- Standardise Key Performance Indicators: Agree on a core set of KPIs that everyone across the sales organisation will use. This simple step ensures that from the newest rep to the Chief Revenue Officer, everyone is speaking the same language and pulling in the same direction.
- Establish a Review Cadence: Data is pointless if it just sits there. You need to build a firm rhythm for reviewing and acting on it. This means daily team huddles checking activity metrics, weekly pipeline reviews, and formal Quarterly Business Reviews (QBRs) to make strategic shifts. This cadence is what turns reporting from a passive chore into the active, beating heart of your business.
Frequently Asked Questions
As you start to weave e-reporting and sales analysis into the fabric of your operations, a few common questions are bound to pop up. Let's tackle them head-on to clear up any confusion and pave the way for a successful rollout.
Our Data Is A Mess. Where Do We Even Begin?
It’s easy to get overwhelmed by the idea of a massive data overhaul. Don't boil the ocean. Instead, start small by picking one high-impact business problem to solve.
For example, zero in on a single critical question like, "Which of our marketing channels actually brings in the most profitable customers?" Answering this just requires connecting two key sources: your CRM and your ad platform data. Nail that, and you've got a tangible win—maybe a 5% boost in marketing ROI in just one quarter. This kind of quick success builds the momentum you need to get buy-in for bigger data projects down the line.
What’s A Realistic Timeline to See A Return On Our Investment?
You’ll start seeing the early signs of a return within the first quarter. These are what we call leading indicators—things like a 20% drop in how long it takes to respond to a new lead, or just a noticeable uptick in daily sales activities logged in the CRM. They show the new process is working.
The real, hard-hitting results—what we call lagging indicators—usually take about six to nine months to show up. This is when you'll see a measurable lift in your conversion rates or a real drop in what it costs to acquire a new customer.
This timeframe is important because it gives you enough data to spot genuine trends, allowing your team to make smart strategic moves based on solid patterns, not just temporary blips.
How Can We Make Sure Our Team Actually Uses These New Tools?
Getting your team on board comes down to three things: making it relevant, making it easy, and leading by example.
First, pull your sales leaders into the design process from day one. If the dashboards answer the questions they're already asking every day, they'll use them. It's about practical insights, not just pretty charts.
Second, put the analytics right where they live—inside their CRM. A sales manager is far more likely to check performance data if they don't have to log into a separate system. Finally, leadership has to walk the talk. Use the dashboards as the single source of truth in every sales meeting. When your team sees that decisions are being driven by this data, they'll quickly understand its value.
Ready to uncover the 'why' behind your sales numbers? See how DialNexa brings conversational intelligence into your reporting, giving you insights you simply can't find anywhere else. Explore our solutions and see what's possible.
Leave a Reply