Designing a High-Performance Sales process flowchart that Drives C-Suite Goals
A sales process flowchart is your revenue engine's blueprint. It’s a visual map that lays out every critical step, decision, and handover required to guide a prospect from initial awareness to a loyal, high-value customer. For senior leadership, it moves beyond a simple sales pipeline by detailing not just the what, but the strategic how and why behind each stage, directly tying operational actions to financial outcomes.
Beyond the Pipeline: Why VPs and Directors Need a Sales Flowchart
As a sales leader, you live and breathe your pipeline. It’s your go-to for forecasting and understanding what’s in motion. But when you're staring down inconsistent team performance or watching deals stall, the pipeline doesn't give you the full story. It won't explain why your top performers are closing at a 20% higher rate or why a staggering 48% of deals, according to Forrester Research, get stuck right after you send the proposal.
That’s where a flowchart comes in. It's your strategic blueprint, moving beyond vague stage names to visualise the real-world actions and decision points that make up your revenue engine. This is where you find the hidden friction—the operational inefficiencies that silently erode margins and stall growth. By mapping the entire customer journey, you can finally pinpoint the exact moments where momentum dies and costly revenue leaks occur.
From Vague Stages to Actionable Steps
A well-designed sales process flowchart is the key to turning abstract goals into concrete actions, helping you effectively build a sales pipeline that drives predictable revenue. While a pipeline might just have a stage called "Qualification," a flowchart breaks that down into the specific, measurable actions that drive a deal forward.
Consider this practical example for a B2B software company:
- Action: An SDR conducts a 15-minute discovery call with a new inbound lead.
- Decision: Does this prospect meet BANT criteria (Budget over $50K, Authority at Director level, Need confirmed, Timeline within 6 months)?
- Path 1 (Yes): The lead is converted to a Sales Qualified Lead (SQL) within the CRM and automatically routed to the appropriate Account Executive's calendar for a demo within 48 hours.
- Path 2 (No): The lead is automatically enrolled in a 6-month marketing nurture sequence tailored to their industry, keeping them warm without consuming valuable sales resources.
This level of detail transforms your sales motion from an art form mastered by a few top reps into a science that everyone on the team can execute, measure, and optimize.
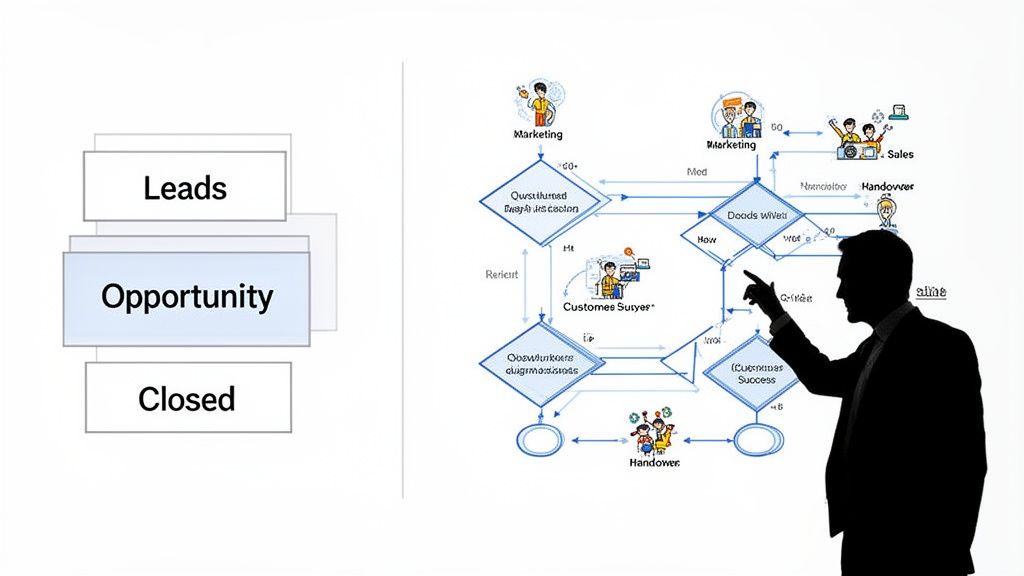
Pipeline View vs Flowchart View: A Strategic Comparison for Leaders
While a pipeline provides a crucial snapshot for forecasting, a flowchart delivers the operational intelligence needed to improve the numbers you're forecasting. For a C-suite audience, this is the difference between reporting the news and making the news.
| Attribute | Sales Pipeline (The What) | Sales Process Flowchart (The How & Why) |
|---|---|---|
| Primary Focus | Deal status and revenue forecasting | Process efficiency, team actions, and cost of sale |
| Value to C-Suite | Answers: "Will we hit our quarterly number?" | Answers: "Why are we winning/losing deals, and how can we improve?" |
| Unit of Measure | Deals and their monetary value | Actions, decisions, conversion rates, and time-in-stage |
| Identifies | Deals at risk of slipping past the close date | Systemic bottlenecks, skill gaps, and process flaws impacting profitability |
| Output | A high-level dashboard for financial reporting | An actionable, repeatable playbook for scalable growth |
Ultimately, the pipeline shows you the score, but the flowchart gives you the game tape you need to coach your team to consistently win.
An EdTech Case Study in Clarity
I once worked with a competitive EdTech firm in India that was bleeding leads during their student counselling phase. Their pipeline was clear: leads were entering the "Counselling" stage but a huge chunk never made it to "Application Submitted." The why was a complete mystery, costing them an estimated $500,000 in potential revenue each quarter.
So, we built a flowchart. We mapped every single interaction—the first automated SMS, the counsellor's initial call, the follow-up email with course details, and the final push to get the application in.
The flowchart immediately exposed a massive bottleneck. When students raised common objections like "the course fees are too high," counsellors had no standard procedure. They were winging it, leading to inconsistent messaging and lost leads.
We redesigned the flowchart to include a specific decision point for handling objections, arming the team with proven scripts and ROI calculators.
The result? A 35% reduction in lead drop-off in a single quarter. This wasn't just a sales win; it was a strategic victory born from process clarity that directly impacted their revenue predictability and market share.
Interestingly, while the Indian retail market shows a strong shift toward organised channels, specific data on how Indian businesses in sectors like EdTech or BFSI internally structure their sales processes is not widely available. This makes creating and refining a custom sales process flowchart even more critical for gaining a competitive edge. Learn more about Indian retail sales trends on Statista.com.
Laying the Groundwork: Defining Your Sales Stages and Roles
Before you can draw a single line on your flowchart, you need to define what you're mapping. A powerful sales process flowchart isn't built on vague, off-the-shelf stages like 'Prospecting' or 'Closing'. It's carved out of the real-world milestones that make up your specific sales cycle. This creates a common language for everyone involved in revenue generation.
When this clarity is missing, your teams operate with a faulty map. It’s no surprise that companies with a formal, well-defined sales process report 18% more revenue growth than those that don't. This isn't about bureaucracy; it's about precision. The objective is to move past fuzzy labels and lock down concrete, verifiable steps that show how a deal actually progresses.
Get Specific: Move Beyond Generic Labels
Generic stages are where deals go to die and forecasts become fiction. What does "Qualified" even mean? When stages are open to interpretation, forecasting becomes a guessing game, and handovers between teams create friction and dropped leads.
The fix is to translate your business reality into specific, actionable stages.
- For a Real Estate Firm: Don't just say "Negotiation." Break it down into tangible steps like "Site Visit Confirmed," "Booking Form Submitted," and "Token Amount Received." Each one is a clear, undeniable step forward.
- For a BFSI Company: Vague terms are a massive compliance risk. You can't just have a stage called "Closing." It needs to be precise: "KYC Verification Complete," "Initial Investment Mandate Signed," and "Account Activated."
- For an EdTech Platform: The journey of a student has its own unique checkpoints. Think in terms of "Counselling Session Completed," "Application Fee Paid," and "Enrollment Confirmed."
These industry-specific stages aren't just semantics; they're strategic anchors. They ensure everyone, from a new sales hire to the CFO, knows exactly where a deal stands based on customer action, not just a salesperson's optimism.
Get Everyone in a Room: The Cross-Functional Workshop
A process designed in isolation by leadership is a process the front lines will ignore. The only way to get true buy-in is to bring everyone together in a cross-functional workshop. This isn't just another meeting; it's a strategic session to build a shared understanding of the actual customer journey.
Your mission is to get sales, marketing, and operations in the same room. Sales knows the real-world objections, marketing understands the first touchpoints that generate high-value leads, and operations sees where post-sale processes get clunky. You absolutely need all of their insights.
Here’s a simple framework for running this critical workshop:
- Start with Your Wins: Analyze the last 10-20 closed-won deals. Trace their journey from the first touchpoint to the final signature, noting every key interaction, decision, and document that moved the deal forward.
- Learn from Your Losses: Do the same for deals you lost, especially those that fell apart late in the game. A 30% drop-off after the proposal stage is a critical red flag that needs investigation. Where did they drop off? This is how you find the weakest links in your current process.
- Map the Customer's View: Put internal CRM stages aside. On a whiteboard, map the journey from the customer's perspective. You'll be amazed at the steps you've been overlooking that cause friction for your buyers.
Out of this collaborative deep dive, your true sales stages will emerge—built on real data and validated by the very people who will use them daily.
Who Does What? Clarifying Roles and Handoffs
Once you've nailed down the stages, the next vital step is to assign clear ownership. A significant portion of revenue is lost to confusion over who is responsible for a lead. A lead that sits in a queue for even 30 minutes before first contact can see its conversion potential nosedive by over 21 times, according to a landmark study by LeadResponseManagement.org.
Your sales process flowchart must spell out, without ambiguity, who is responsible for what and when a handover should occur.
| Stage | Primary Owner | Handoff Trigger | Receiving Owner |
|---|---|---|---|
| Marketing Qualified Lead (MQL) | Marketing Automation | Lead Score > 80 | Sales Development Rep (SDR) |
| Sales Accepted Lead (SAL) | SDR Team | BANT Criteria Met on Discovery Call | Account Executive (AE) |
| Contract Sent | Account Executive | Verbal Agreement on Terms | Legal Team |
| Deal Won | Account Executive | Signed Contract Received | Customer Success Manager |
This level of detail eliminates the "I thought you were handling it" excuse. It builds a system of accountability where every lead is actively managed, ensuring a seamless customer experience and maximizing revenue potential at every stage.
Mapping the Customer Journey: From First Touch to Final Handshake
Now that you've laid the groundwork by defining your stages and roles, it's time to translate that strategy into a visual, actionable map. This is where your sales process flowchart truly comes alive, shifting from a simple list into a dynamic guide that tells your team precisely what to do, when to do it, and what comes next.
Think of this as creating a paved road for every prospect interaction, guiding them from their first brand encounter all the way to the final handshake. This isn't just an academic exercise. A detailed visual map shines a light on hidden cracks in your process—inefficiencies and revenue leaks impossible to spot on a CRM dashboard. The data backs this up; companies that visually map and manage their sales process consistently see higher win rates and shorter sales cycles.
This flowchart shows the core journey, breaking it down into three fundamental phases: prospecting, qualifying, and closing.
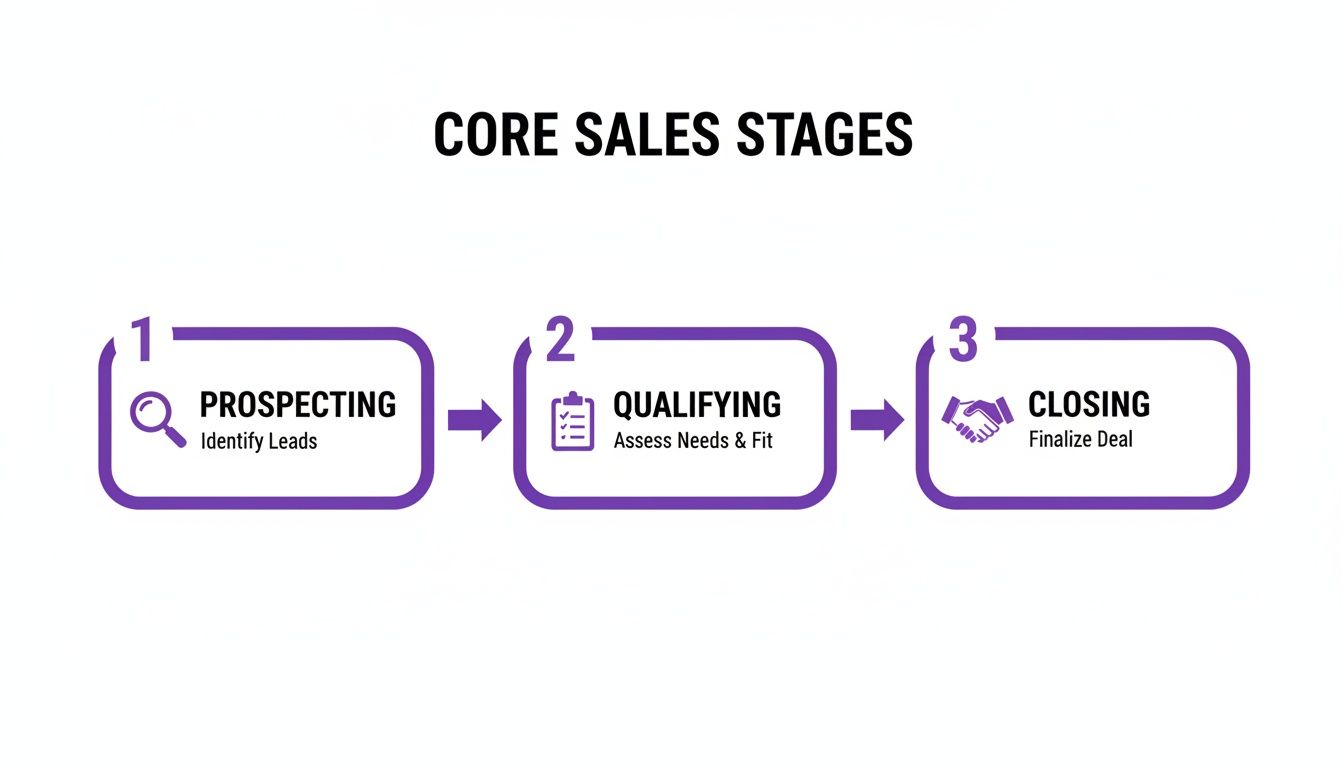
By thinking about the process this way, you can start assigning specific actions and KPIs to each major phase, which becomes the foundation of your detailed flowchart.
A Real-World B2B SaaS Example
Let's get practical. Imagine you're a B2B SaaS company and a prospect from a target account fills out a demo request form. That one action should kick off a flawless, repeatable series of steps.
Your flowchart starts with a trigger: "Demo Request Received". The first decision point is immediate: Is this lead qualified? Your flowchart must define what "qualified" means. For instance, is the company size over 50 employees? Is it in a target industry (e.g., Finance, Healthcare)?
- If Yes: The lead is routed directly to an SDR's queue with a Service Level Agreement (SLA) mandating a first contact attempt in under 5 minutes. Speed is non-negotiable here.
- If No: The lead is automatically funnelled into a marketing nurture sequence designed for smaller businesses, preventing wasted sales effort.
This simple fork in the road is a game-changer. It stops your high-cost sales reps from wasting precious time on leads that were never going to convert.
Charting the 'Yes' and 'No' Paths
Let's follow that qualified lead. The SDR connects and successfully books the demo. The flowchart now advances to the "Demo Scheduled" stage. The next critical question is: "Did the prospect show up?"
This is a classic point where processes fall apart. Your flowchart needs to dictate the exact next steps for both scenarios.
The 'Yes' Path (They Attended)
- The Account Executive (AE) who ran the demo immediately updates the CRM.
- Next decision: Was it a good demo? Did the prospect show clear buying intent (e.g., asked about pricing, integration)?
- If yes, the AE sends a customised proposal within 24 hours, and the deal moves to the "Proposal Sent" stage.
- If not, the AE places them into a specific follow-up sequence with content addressing their likely hesitations.
The 'No' Path (A No-Show)
- The AE marks them as a no-show in the CRM.
- This triggers an automated email and SMS sequence to reschedule. A sequence of 3-4 touchpoints over five days is highly effective.
- Next decision: Did they reschedule?
- If yes, they re-enter the "Demo Scheduled" stage.
- If they ignore the sequence, they're moved to a "Long-Term Nurture" list, now owned by marketing.
By visually mapping these binary paths, you remove all guesswork. Your team knows precisely how to handle a no-show versus an engaged prospect. It creates consistency and stops good leads from slipping through the cracks. For a deeper look at this, it's worth understanding the role of voice in customer journey mapping.
Don't Just Map the Happy Path—Map the Bumps
The biggest mistake leaders make is mapping only the ideal "happy path" where every prospect says 'yes'. Real sales is messy. The real power of a flowchart is in guiding your team through inevitable objections and roadblocks.
Take the "Proposal Sent" stage. What happens when the prospect emails back saying, "Your price is too high"? Your flowchart should have a playbook for that.
Scenario: The Budget Objection
- Trigger: Prospect flags the price as an issue.
- Action: The AE uses a pre-approved script to dig deeper. "Compared to what?" is a powerful opening question. Is it a cash flow problem?
- Decision Point: Based on the conversation, can you offer a different payment plan or an annual discount?
- Path 1 (Yes): The AE gets approval from their Sales Manager (if the flowchart requires it for discounts over 10%) and sends a revised proposal.
- Path 2 (No): The AE marks the deal as "Closed-Lost (Pricing)" and adds the prospect to a nurture track that continuously highlights ROI and shares powerful customer case studies.
When you map common deviations, you equip your entire team to handle them with the same skill as your top performer. It standardises excellence. Your flowchart evolves from a simple diagram into a powerful machine that exposes bottlenecks and builds a predictable revenue engine.
Measure What Matters with Actionable KPIs
A sales process flowchart without metrics is just a pretty picture. For any senior leader, the real power is unlocked when it becomes a living dashboard for performance. You get there by embedding the right Key Performance Indicators (KPIs) into every stage.
This isn't about chasing vanity metrics. It’s about zeroing in on the numbers that tell you what’s going on with your revenue engine. When you map KPIs onto your flowchart, you turn a diagram into a powerful diagnostic tool. You can see at a glance which stages are running smoothly and which ones are conversion black holes.
Identifying Stage-Specific KPIs
To make your flowchart useful, you must assign specific, relevant KPIs to each milestone. This changes the conversation from a vague "Why did we miss our target?" to a pointed "Why is our demo-to-trial conversion rate 15% below our benchmark?"
Let’s get practical with some real-world examples:
- For a B2B SaaS Company: At the "Demo Scheduled" stage, the real story is in the Demo Attendance Rate. If that number dips below 75%, it’s a clear signal that your pre-demo communication is weak or the lead quality is poor.
- For a Real Estate Firm: After a property viewing, the crucial metric becomes the Time from Site Visit to Token Payment. If this stretches beyond 7 days, it could point to a lack of urgency in your follow-up.
- For a BFSI Organisation: Once an application is submitted, the Time-to-KYC Approval is make-or-break. Every hour of delay increases the risk of a potential customer walking away—a problem you’d never spot without tracking this specific metric.
Attaching these granular KPIs to your flowchart creates an early-warning system. You don’t have to wait until the end of the quarter to discover that things are going sideways.
Pinpointing Revenue Leaks and Bottlenecks
Once you start visualising these KPIs on your flowchart, it becomes shockingly easy to see where your process is breaking down. Imagine seeing a healthy flow of leads moving through "Initial Contact," only to hit a massive cliff at the "Proposal Sent" stage.
That’s not just a data point; it’s a bright red flag. It tells you immediately that the problem probably isn't with lead generation. The real issue is likely buried in how you communicate value or your pricing. A 40% drop-off here strongly suggests that once prospects see the price, they aren't convinced of the ROI.
This data-driven insight allows for surgical interventions. Instead of a generic "we need to sell better" memo, you can launch a targeted initiative to retrain the team on handling price objections or redesign your proposal template to better articulate the value proposition.
Setting Baselines and Driving Accountability
Once you’ve defined your KPIs, the next step is to set clear baselines and targets for each one. This builds a culture of accountability and pushes everyone towards continuous improvement.
For instance, you might establish a set of targets like this:
| Stage KPI | Industry Benchmark | Your Target |
|---|---|---|
| Lead Response Time | Under 15 Minutes | Under 5 Minutes |
| MQL to SQL Conversion | 13% | 15% |
| Demo to Trial Rate | 20% | 25% |
| Average Sales Cycle | 84 Days | 75 Days |
These targets give your team a clear destination. And when it comes to boosting team performance, having solid metrics is non-negotiable. To get more ideas, you can learn how to measure the performance of your voice agents with key metrics in our detailed guide.
This data-first approach pulls performance reviews out of subjective opinion and grounds them in objective reality. It helps managers have far more effective coaching conversations and shows every team member exactly how their individual actions contribute to the bigger picture. Your sales process flowchart is no longer just a map; it's your single source of truth for what great performance looks like.
Powering Up Your Flowchart with AI and Automation
Once you've mapped out your sales process, the next question from leadership is always, "How do we make this faster and more efficient?" That's where your flowchart proves its worth. It becomes your blueprint for intelligent automation.
Trying to automate without a clear flowchart is a recipe for disaster. I've seen companies end up with a tangled mess of expensive tools that don't talk to each other. Your flowchart shows you exactly where technology can plug in and make a real difference, turning a static plan into a dynamic, money-making machine.
Finding the Best Spots to Automate
Think of your flowchart as a treasure map. By looking at each stage, you can instantly spot the repetitive, time-sucking tasks bogging down your team. These are the low-hanging fruit where AI and automation can give you the biggest and fastest return on investment. It’s about freeing up your star players to focus on what they do best: closing big deals and building strong client relationships.
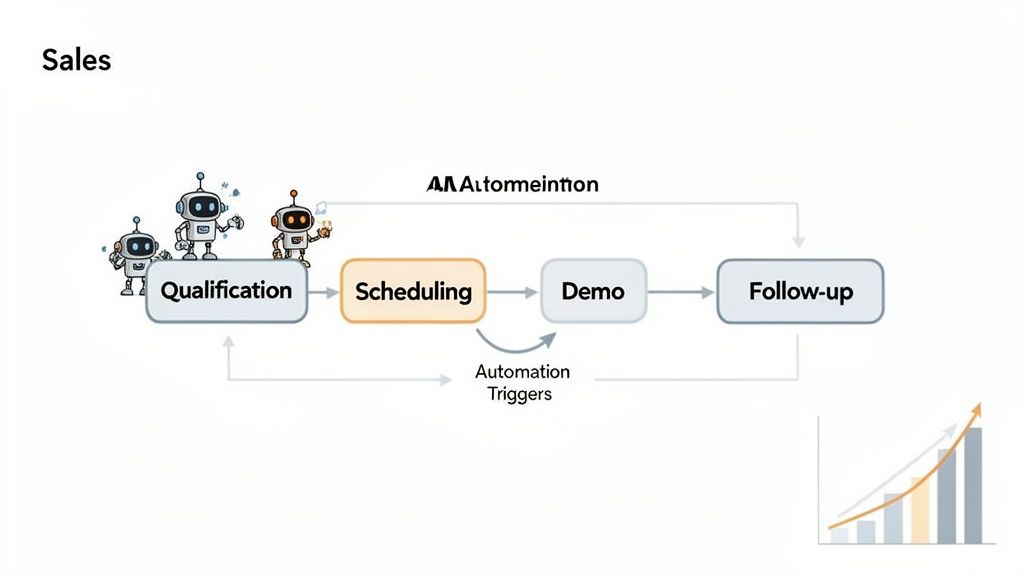
From my experience, these areas are almost always ripe for an upgrade:
- Initial Lead Qualification: How many hours do your sales reps waste on initial calls just to find out if a lead has the budget or authority to buy? This is a perfect job for a Voice AI agent. It can handle that first touchpoint, ask the crucial qualifying questions, and pass only serious prospects on to your team.
- Appointment Scheduling: The endless email ping-pong to find a meeting time is a classic productivity killer. Automating this with smart scheduling links means qualified leads can book a demo the second they're interested. This simple change drastically cuts down the friction and can shorten the sales cycle by days.
- Post-Demo Follow-up: A fantastic demo can fall flat if the follow-up is slow. Automated email sequences can fire off a summary, relevant case studies, and a clear call to action the moment a call ends, keeping momentum going while you’re top of mind.
By automating the top of your funnel, you’re not replacing your sales team. You’re building them a pipeline of perfectly qualified, warmed-up leads who are actually ready to talk. That's how you scale revenue without burning out your best people.
From Blueprint to Bottom Line: A Real-World Example
The power of this approach really hits home when you see the numbers. We worked with a fast-growing EdTech company whose first two stages—'Initial Contact' and 'First-Level Qualification'—were completely manual, creating a massive bottleneck. Their student counsellors were spending over 60% of their day making outreach calls, and most went to voicemail or to unqualified prospects.
We brought in a Voice AI agent to take over these initial steps. The AI handled the first wave of calls, engaged students in a natural conversation to gauge their interest, and then seamlessly booked qualified leads into a counsellor's calendar.
The data was staggering:
- Their connect rate shot up from a painful 47% to an incredible 91%. The AI could simply make more calls with more persistence than any human team ever could.
- Even better, their lead-to-booking conversion rate more than tripled, jumping from 2% to 8%.
This single change allowed their expert counsellors to spend their time on what truly mattered: having high-intent conversations with students who were ready to enrol. This is a perfect illustration of how your flowchart can guide technology to deliver results that line up perfectly with C-suite goals for growth. You can explore how AI voice agents are transforming sales to see more on this.
Answering Your Team's Questions About Sales Process Flowcharts
When you roll out a new sales process flowchart, expect questions. Your team and other stakeholders will have valid concerns, and getting ahead of them is key to getting everyone on board. Treating these questions seriously shows this isn't just another top-down directive, but a practical tool designed to make everyone's job easier and more effective.
What's the Biggest Mistake People Make With These?
Easy. The single biggest mistake is building the flowchart in an executive bubble without talking to the people who are actually on the front lines—your sales and marketing teams. When you design a process from an ivory tower, you end up with something that looks great on paper but falls apart in the real world.
A process built without the team's input is dead on arrival. Imagine creating a flowchart that has no step for handling budget objections. Your reps face that every single day. If the map doesn't reflect the territory, they won't use it. The golden rule is to build it together.
How Often Should We Be Updating Our Flowchart?
Think of your sales flowchart as a living document. It's not a "set it and forget it" kind of thing. The market changes, customer expectations shift, and your process needs to keep up.
As a rule of thumb, you should plan for a major review at least annually. You'll also need to revisit it any time there's a big shift in the business, like:
- Launching a new product or service.
- Expanding into a new region or market.
- A major change in your go-to-market strategy.
On top of that, it's smart to do smaller, quarterly check-ins. This is your chance to make minor adjustments based on what the data is telling you and what you're hearing from the team. Continuous refinement is what keeps your process sharp.
Is It Possible for a Flowchart to Be Too Detailed?
Oh, absolutely. There's a fine line between detailed and dogmatic. A flowchart that tries to script every single word and map every tiny possibility becomes a straitjacket, not a guide. The goal is to provide a clear path, not a complex labyrinth.
Focus on mapping the critical stages, the key decision points, and the most common scenarios your team will encounter. If a specific part of the process, like the legal review for an enterprise contract, is especially complicated, break it out into its own, separate flowchart. That way, the main sales map stays clean, scannable, and actually useful during a live deal.
Ready to see what your sales process looks like with intelligent automation built-in? DialNexa offers human-like Voice AI agents that can handle lead qualification, appointment setting, and initial outreach. This frees up your sales team to do what they do best: build relationships and close deals. Discover how DialNexa can transform your sales flowchart into a revenue-generating engine.
[…] transforms quota setting from a top-down directive into a strategic dialogue, ensuring your sales process flowchart aligns with both financial commitments and on-the-ground […]
[…] in terms of process design. If you're working through that at leadership level, this guide to optimizing sales processes for C-suite goals is useful because it ties workflow design to commercial outcomes rather than rep […]