The Utilization Formula in BPO: A CXO’s Guide to Profitability
The utilization formula in BPO is more than just a calculation; it’s a direct measure of your operational efficiency and a key driver of profitability. Simply put, it's the percentage of an agent's paid time spent on productive, billable tasks. For senior leaders, mastering this formula isn't about micromanaging floor activity; it's about transforming your largest operational expense—your workforce—into a measurable, high-performing asset.
Why BPO Utilization Is a C-Suite Conversation
For too long, utilization was perceived as a floor manager’s metric, just another number on a sprawling dashboard. That's a dangerously narrow view. For Directors, VPs, and CXOs, BPO utilization isn't merely about keeping agents busy. It's a powerful strategic lever for steering profitability, ensuring scalability, and sharpening your competitive edge. It answers the one question that truly matters: "Are we generating the maximum possible return on our payroll investment?"
Think of your agent pool not as a cost center, but as a portfolio of revenue-generating assets. The utilization formula in BPO is the primary tool for measuring that portfolio's performance. Every percentage point gained in utilization flows directly to healthier margins, more competitive pricing, and a stronger bottom line.
Connecting Utilization to Strategic Outcomes
Low utilization is a red flag for systemic inefficiency. It signals that you're paying for excessive idle time, you're chronically overstaffed, or your operational processes are bleeding capital. Conversely, a high, sustainable utilization rate indicates your teams are laser-focused on activities that directly drive client success and company revenue. In a market this competitive, that level of efficiency is non-negotiable.
Consider the Indian BPO sector. The utilization formula is central to its workforce optimization strategy. Valued at USD 6,077.36 million in 2022, India's BPO market is projected to nearly double by 2030. This growth is underpinned by high agent utilization rates, which typically range between 75-85%. Post-pandemic, many firms saw utilization climb to 82% after integrating AI-driven scheduling. You can explore the growth drivers of the BPO market in India to understand the full strategic landscape.
As a leader, your focus must shift from merely tracking activity to strategically maximizing output. A well-managed utilization rate is what enables you to scale operations intelligently, onboard new clients without proportional increases in headcount, and safeguard profit margins against market pressures.
To help leaders connect the dots between this operational metric and its strategic importance, here’s a quick breakdown.
BPO Utilization At a Glance for Leaders
| Metric Component | Definition | Impact on Business | Key Objective for CXOs |
|---|---|---|---|
| Productive Time | The total time agents spend on billable activities like calls, emails, and chat. | Directly generates revenue and fulfils client contracts. | Maximize this time without causing agent burnout. |
| Total Paid Time | The full duration an agent is paid for, including breaks, training, and meetings. | Represents the total labour cost investment. | Control non-productive paid time through efficient scheduling and processes. |
| Utilization Rate (%) | The ratio of productive time to total paid time (Productive / Total Paid). | A direct indicator of workforce efficiency and profitability. | Achieve and maintain a target utilization rate that balances cost, quality, and morale. |
Ultimately, a strong grasp of the utilization formula empowers you to make sharp, data-driven decisions that benefit the entire organization. It connects directly to:
- Financial Health: Draws a straight line between labour costs and revenue, giving you a crystal-clear view of workforce ROI.
- Operational Excellence: Shines a light on process bottlenecks, scheduling gaps, and prime opportunities for automation.
- Client Satisfaction: Ensures you have the right number of people to meet Service Level Agreements (SLAs) without the financial drain of overstaffing.
- Strategic Growth: Provides the hard data needed to accurately forecast staffing and scale your business profitably.
Mastering the utilization formula in BPO is a C-suite responsibility. It elevates the conversation from operational minutiae to strategic value creation, ensuring your workforce isn't just busy, but actively building the business.
Breaking Down the Core Utilization Formula
At its core, the BPO utilization formula is a simple but incredibly telling measure of your workforce's return on investment. It cuts through operational clutter to provide a clear, financial-grade metric on how effectively you convert paid hours into profitable work. Getting this calculation right is the foundational step toward strategically managing your largest asset: your people.
The foundational equation is straightforward:
Utilization % = (Total Productive Hours ÷ Total Available Hours) x 100
This formula tells you exactly what percentage of an agent's paid time is actually spent on activities that serve clients and generate revenue. For a director or VP, this isn't just another number—it’s a direct reflection of your operational efficiency and a key indicator of your financial health.
To fully appreciate its strategic weight, let's unpack the two core components.
Understanding the Core Components
The power of the utilization formula lies in its two main variables. If you don't define these correctly, you'll get a skewed picture of your business.
1. Total Productive Hours
This is the sum of all time your agents spend on billable, client-facing work. Think of it as "revenue-generating time." This is the value-add. It typically includes:
- Talk Time: The actual time spent speaking with customers on calls.
- Case Handling: Time spent actively working on customer issues through email, chat, or other channels.
- After-Call Work (ACW): Necessary wrap-up tasks like logging notes, updating the CRM, and closing tickets.
Essentially, this metric is your output. The more productive hours your team logs without increasing total costs, the healthier your margins will be.
2. Total Available Hours
This figure represents your total investment in an agent’s time. It’s the entire block of time an agent is paid for, whether they are actively working on a client task or not. This bucket includes everything:
- Productive hours (as defined above).
- Paid breaks and lunch.
- Team meetings and coaching sessions.
- Mandatory training programs.
- Idle time between calls or tasks.
From a leadership perspective, this metric represents your total labor cost. The strategic objective is to ensure the largest possible portion of these available hours is converted into productive, billable work.
A Practical Example of the Formula
Let's put the BPO utilization formula to work in a real-world scenario. Imagine you're the VP of Operations for a BPO with a dedicated team of 10 agents for a key client. Each agent works a standard 8-hour shift, five days a week.
Step 1: Calculate Total Available Hours
- Each agent is paid for 8 hours a day.
- Total daily available hours per agent = 8 hours
- Total weekly available hours per agent = 8 hours/day x 5 days/week = 40 hours
- Total weekly available hours for the team = 40 hours/agent x 10 agents = 400 hours
This 400 hours represents your total weekly payroll investment for this team.
Step 2: Calculate Total Productive Hours
Now, let’s track their actual output for the week.
- The team spent a combined 250 hours on active calls with customers.
- They logged another 30 hours on essential after-call work (ACW).
- Total weekly productive hours = 250 hours + 30 hours = 280 hours
Step 3: Calculate the Utilization Rate
Plugging those numbers into our formula:
- Utilization % = (Total Productive Hours ÷ Total Available Hours) x 100
- Utilization % = (280 ÷ 400) x 100
- Utilization % = 70%
This 70% result tells you that for every dollar you spent on payroll, 70 cents went directly toward client-facing, revenue-generating activities. The other 30 cents were absorbed by necessary but non-billable time like breaks and training. As a strategic leader, this 70% is your baseline. From here, you can ask critical questions: Can we reduce idle time through better scheduling? Can we streamline ACW with automation? This is where utilization transforms from a simple metric into a tool for driving profitability.
Utilization vs Occupancy: Making the Critical Distinction
It’s a common mistake in leadership meetings: using the terms ‘utilization’ and ‘occupancy’ interchangeably. While they seem similar, they tell two fundamentally different stories about your operation. Confusing them isn't a minor slip-up; it's a strategic error that can lead to flawed staffing decisions, budget overruns, and a distorted view of your team's true performance.
Utilization is the 30,000-foot strategic view. It assesses an agent’s entire paid shift and answers a simple, powerful question: of all the hours we are paying for, how many are actually spent on productive, customer-facing work? This is your ultimate ROI metric. It cuts through the noise and tells you precisely how much value you're extracting from your largest investment—your people.
Occupancy, conversely, is the tactical view from the ground. It zooms in only on the time an agent is logged in and ready to handle customer interactions. It completely ignores paid breaks, team meetings, or training. Its focus is singular: when an agent is supposed to be working, how busy are they?
An Analogy for the Boardroom
To make this crystal clear for executive-level discussions, imagine you've hired a team of high-value consultants.
Utilization is like analyzing their entire 40-hour paid work week and asking, "How many of those hours were genuinely billable to our client?" This reveals the true ROI on their substantial fees.
Occupancy is like focusing only on the 6 hours they blocked out for 'active project work' on Tuesday and measuring how much of that specific window was spent in client meetings versus waiting for information. It's a measure of their busyness during their available time.
You can immediately see the difference. A consultant could boast 100% occupancy during their dedicated work blocks but have a dismal 60% utilization for the week because the other paid hours were consumed by non-billable internal admin. As a leader, you need both perspectives. One informs immediate workload management, while the other guides long-term financial strategy.
Utilization vs Occupancy: A Strategic Comparison
Knowing which lens to look through—utilization or occupancy—is what separates effective managers from great strategic leaders. High occupancy might create the illusion of a highly productive team, but if utilization is low, it’s a critical red flag that you're paying for a significant amount of unproductive time. This distinction is absolutely vital for accurate forecasting and intelligent resource planning.
To help you drive more effective operational reviews, here’s a table that breaks down the key differences.
| Aspect | Utilization | Occupancy | Strategic Question Answered |
|---|---|---|---|
| Scope of Time | Measures an agent's entire paid shift (e.g., 8 hours). | Measures only the time an agent is logged in and "available" for work. | "What is the overall ROI on my payroll investment?" |
| Formula | (Total Productive Hours / Total Paid Hours) x 100 | (Total Handle Time / Total Available Time) x 100 | "How busy are my agents when they are supposed to be working on tasks?" |
| Purpose | Strategic; assesses overall workforce efficiency and profitability. | Tactical; assesses real-time agent workload and scheduling effectiveness. | "Are my operational processes efficient, or am I paying for too much idle time?" |
| Key Insight | Reveals the financial return on your total labour cost. | Reveals immediate staffing needs and potential for agent burnout. | "How effectively are we turning paid hours into revenue-generating work?" |
Ultimately, the utilization formula in BPO is a financial tool for strategic thinkers. Occupancy is an operational tool for floor managers. A leader focused on utilization ensures the entire operational engine is geared for profitability, not just busyness. Using them in tandem provides a complete picture, allowing you to fine-tune daily operations while never losing sight of the long-term financial health of your business.
Applying the Utilization Formula in Your BPO
Understanding the theory behind the utilization formula in BPO is foundational, but the real value is unlocked when you apply it to make sharp, strategic decisions. For any BPO leader, the true test is converting this calculation into actionable intelligence across diverse operational models.
Let's walk through a few practical scenarios that reflect common BPO environments.
This visual provides a bird's-eye view of how these metrics interconnect. It illustrates how an individual agent's performance contributes to the bigger picture, linking day-to-day occupancy with the high-level financial oversight that utilization provides.
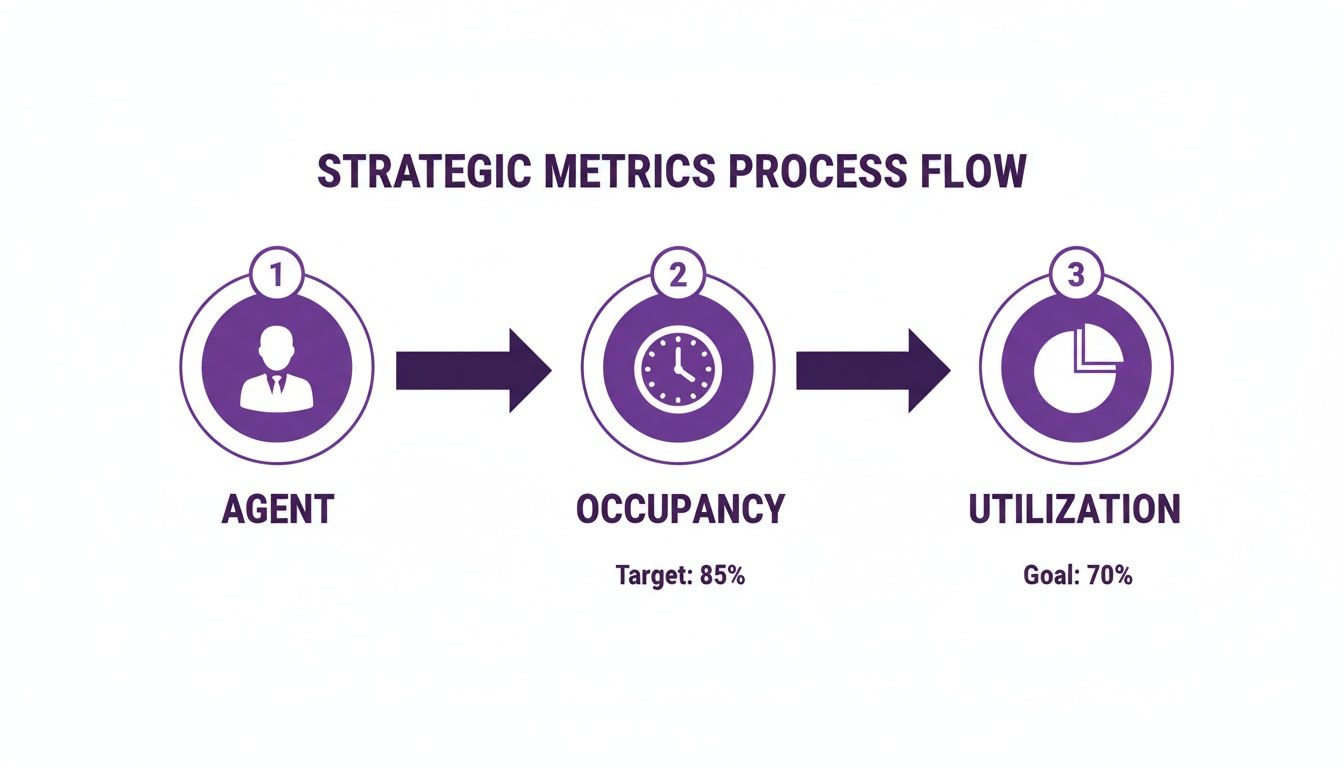
As you can see, occupancy measures an agent's immediate busyness. Utilization, however, reveals how all that activity translates into bottom-line productivity and value for the business.
Scenario 1: A High-Volume Customer Support Call Center
The Business Challenge: You run a 50-agent inbound support center for a major retail client. The primary goal is to meet a strict Service Level Agreement (SLA) without overspending on payroll, a major cost center.
Data Points:
- Total Roster Hours: 50 agents × 8 hours/day = 400 hours
- Total Paid Breaks: 50 agents × 1 hour/day = 50 hours
- Team Meeting/Training: 50 agents × 0.5 hours/day = 25 hours
The total paid hours (your denominator) is 400 hours.
Productive Output:
- Total Talk Time: The team spends a combined 240 hours on the phone with customers.
- After-Call Work (ACW): They log another 40 hours updating the CRM and closing tickets.
- Total Productive Hours: 240 + 40 = 280 hours.
Calculation & Strategic Insight:
Utilization = (280 Productive Hours / 400 Available Hours) × 100 = 70%
A 70% utilization rate means that for every ten hours of payroll, seven are spent directly serving customers. The remaining three hours are consumed by necessary activities like breaks and training. From a CXO's perspective, this 70% is a key performance indicator. It prompts strategic questions: Can we optimize our WFM to reduce idle time between calls? Is our ACW process as efficient as it could be? A 2% improvement here could translate into significant annual savings.
Scenario 2: A Back-Office Data Processing Unit
The Business Challenge: You manage a 20-analyst team processing insurance claims. The focus is on throughput and accuracy, measuring productive time by cases handled.
Data Points:
- Total Roster Hours: 20 analysts × 8 hours/day = 160 hours
- Total Paid Breaks: 20 analysts × 1 hour/day = 20 hours
- Quality Assurance (QA) Review: 20 analysts × 1 hour/day = 20 hours
- Total Available Hours = 160 hours
Productive Output:
- Total Time on Cases: The team spends 120 hours actively working on claims.
- Total Productive Hours = 120 hours
Calculation & Strategic Insight:
Utilization = (120 Productive Hours / 160 Available Hours) × 100 = 75%
At 75%, this back-office team shows higher utilization, which is common in environments with less unpredictable "wait time" compared to inbound call centers. For a director, this metric helps in capacity planning. If a new client adds 15% more claim volume, you can reliably forecast that you'll need approximately 18 more productive hours per day, helping you make a data-backed decision on whether to hire new staff or improve existing process efficiency.
Scenario 3: A Hybrid Chat and Voice Operation
The Business Challenge: A modern, 30-agent team handles both voice calls and multiple concurrent chats for a tech startup. The challenge is accurately measuring productivity in a blended environment.
Data Points:
- Total Roster Hours: 30 agents × 8 hours/day = 240 hours
- Total Available Hours = 240 hours
Productive Output:
- Total Voice Talk Time: 80 hours
- Total Time on Chat Support: 90 hours
- Total ACW (for both): 25 hours
- Total Productive Hours: 80 + 90 + 25 = 195 hours
Calculation & Strategic Insight:
Utilization = (195 Productive Hours / 240 Available Hours) × 100 = 81.25%
The high utilization of 81.25% is a direct result of operational efficiency. Agents handling multiple chats simultaneously drastically reduces idle time. For a VP of Strategy, this is powerful data. It demonstrates a strong business case for shifting more customer interactions to asynchronous channels like chat, proving that it not only meets customer preferences but also significantly improves workforce ROI.
These examples show that no matter your BPO's function, the utilization formula is an indispensable tool for measuring financial health and operational muscle. It's also worth exploring how an AI and human customer service model is redefining what's possible in demanding sectors like banking.
Strategic Levers to Improve BPO Utilization
Knowing your utilization rate is step one. Strategically improving it is where true value is created. For senior leaders, enhancing this metric isn't about pushing agents harder; it's about engineering a smarter, more efficient operation. A healthier utilization rate translates directly into superior profit margins, increased capacity for growth, and a business built to scale effectively.
This requires moving beyond minor adjustments to focus on high-impact changes that reshape how the entire workforce operates. The objective is to eliminate systemic inefficiencies, not just to shave seconds off call times.
Optimize Workforce Management and Scheduling
The most direct way to influence utilization is through intelligent workforce management (WFM). If your scheduling is still based on historical averages or gut feelings, you are undoubtedly overstaffed during lulls and understaffed during peaks. Both scenarios are costly and erode your utilization figures.
A Practical Example: A BPO handling e-commerce support was scheduling a flat 50 agents per shift. After implementing a WFM tool with predictive analytics, they discovered a 40% drop in volume between 2 PM and 4 PM but a 30% surge after 6 PM. By shifting to a split-shift model and reducing mid-day staffing to 35 agents while increasing evening staff to 60, they cut idle time by 15% and boosted overall utilization from 68% to 75% within one quarter.
This requires robust capacity planning. It’s worth exploring these essential capacity planning strategies to build a more resilient and efficient forecasting model.
Aggressively Reduce Unplanned Shrinkage
Shrinkage is the silent killer of utilization. It's all the time agents are paid for but are not available to handle customer interactions. While planned activities like training and breaks are accounted for, the real damage comes from unplanned shrinkage: system downtime, unscheduled absences, or technical glitches. This is pure waste.
A Practical Example: A financial services BPO traced a consistent 4% drop in weekly utilization to recurring login issues with their proprietary CRM every Monday morning. The issue was taking, on average, 20 minutes per agent to resolve. By investing in a weekend patch and proactive IT support on Monday mornings, they eliminated this bottleneck. This single fix reclaimed over 30 productive hours each week, directly improving their utilization rate and meeting their Monday SLAs more consistently.
- System Downtime: Ensure your tech stack is reliable. Every minute your CRM or phone system is down, utilization plummets.
- Unplanned Absences: Foster a positive work environment to reduce absenteeism. A motivated workforce is a present workforce.
- Adherence Issues: Use real-time monitoring to track schedule adherence and address deviations proactively.
Develop a Cross-Trained and Agile Workforce
A siloed team where each agent handles only one specific task is inherently inefficient. When one queue is overflowing while another is silent, your overall utilization suffers. The solution is cross-training agents to handle multiple interaction types—such as voice, chat, and email—creating a flexible and agile workforce.
A Practical Example: A telecom BPO was struggling with long wait times for its billing department while the tech support queue was often quiet. They launched a "Skill of the Month" program to cross-train 20% of their tech agents on basic billing inquiries. When the billing queue spiked at the end of the month, these cross-trained agents could be dynamically reassigned. This reduced billing wait times by 60% and increased overall team utilization by 5%, as agents who would have been idle were now handling productive work. To enhance agent skills, learning how speech analytics helps improve coaching and training can be a game-changer.
Why it Matters to a CXO: Agility is a genuine competitive advantage. A cross-trained workforce allows your BPO to adapt to shifting client needs and market demands without the cost and delay of constant hiring cycles. It turns your workforce into a strategic, adaptable asset.
The Future of BPO Utilization with AI
The standard utilization formula in BPO provides a sharp snapshot of current operational efficiency. However, its future power will be unlocked by artificial intelligence. For any executive in a strategic role, it's crucial to see AI not as another tool to be bolted onto existing processes, but as a transformative force that re-engineers every variable in the utilization equation. AI turns this metric from a backward-looking report card into a forward-looking driver of profitability.

AI doesn’t just make agents faster; it optimizes the entire operational ecosystem, making higher utilization a natural outcome rather than a target to be relentlessly pursued. This marks a fundamental shift from managing efficiency to designing it.
Supercharging Productive Time with AI
AI's most immediate impact is on maximizing an agent's productive time. AI-powered assistants can automate the repetitive, time-consuming tasks that dilute an agent's focus.
A Practical Example: Imagine an agent finishes a complex support call. Instead of spending 5-7 minutes manually writing call summaries, updating the CRM, and tagging the ticket, an AI co-pilot does it instantly and with 99% accuracy. This automation can slash After-Call Work (ACW) by 30-50%. For a 100-agent team, this could reclaim hundreds of productive hours per week, allowing agents to move directly to the next revenue-generating interaction. This directly boosts the numerator in the utilization formula.
By automating routine administration, AI reserves your most valuable asset—your agents' cognitive energy—for complex problem-solving and building genuine customer rapport, not for manual data entry.
Optimizing Available Hours with Predictive Analytics
AI also brings a new level of sophistication to managing your total available hours. The chronic challenge of over- and under-staffing is, at its core, a forecasting problem—a problem AI is uniquely suited to solve.
A Practical Example: A BPO serving the travel industry faced unpredictable call volumes driven by weather events and flash sales. By implementing an AI forecasting model that analyzed not only historical data but also weather forecasts, flight cancellation data, and the client's marketing calendar, they could predict demand surges with 95% accuracy. This allowed them to move from reactive to predictive scheduling, reducing idle time by over 20% and improving utilization significantly, especially during volatile periods. Explore how businesses can leverage machine learning for forecasting to see this in action.
This is especially transformative in data-heavy sectors like finance, as detailed in this analysis of how data and AI will transform contact centres for financial services.
You can break down AI's impact on utilization into three key areas:
- Workflow Optimization: AI analytics identify hidden bottlenecks in your processes, showing you precisely where agents are losing time.
- Demand Forecasting: It transforms scheduling from a reactive guessing game into a proactive, data-driven strategy.
- Task Automation: AI handles low-value, repetitive work, freeing up your agents to focus on high-impact interactions that build loyalty and drive revenue.
For today's business leaders, integrating AI isn't a question of if, but how. It’s about elevating a simple operational metric into a central pillar of your digital transformation strategy, unlocking a level of productivity that was previously unattainable. The future of BPO isn’t just about tracking utilization; it’s about mastering it with intelligence.
Your BPO Utilization Questions, Answered
As a leader, you need clear, direct answers to ensure your strategies are sound. Here are some of the most pressing questions that arise when discussing the utilization formula in BPO and its strategic implications.
What Is a Good Utilization Rate for a BPO?
While 75-85% is often cited as an industry benchmark, a 'good' rate is entirely contextual. The ideal target depends on the complexity of the work.
Practical Example: A team providing Level 3 technical support for enterprise software may be highly profitable at 70% utilization. The "non-productive" 30% includes critical time for research, documentation, and collaboration needed to solve complex issues. In contrast, a straightforward appointment-setting team should be pushing closer to 90%. The strategic goal isn't to hit a generic number but to identify the optimal utilization that balances profitability, service quality, and employee well-being for each specific business function.
Can Pushing for High Utilization Cause Agent Burnout?
Absolutely. This is a critical risk for any executive to manage. Chasing maximum utilization without considering the human element is a direct path to agent burnout, declining service quality, and the high costs of employee attrition.
The objective should always be optimal utilization, not maximum. This is achieved through intelligent scheduling, recognizing the strategic value of non-billable training time, and ensuring efficiency gains come from smarter systems and processes—not from overburdening your people.
A balanced approach protects your most valuable asset—your team—while delivering superior financial results.
How Does the Utilization Formula Work for Non-Voice Processes?
The core logic of the formula—dividing Productive Time by Total Available Time—remains identical for non-voice tasks. The only difference is in how you define and measure "Productive Time."
Instead of tracking call duration, you might measure:
- Case Handle Time: Time spent actively working on an insurance claim or processing a mortgage application.
- Transaction Time: Minutes required to complete a financial trade reconciliation.
- Project Logged Time: Time logged against a specific data analysis or content moderation project.
Regardless of the task, the strategic goal is the same: to maximize the revenue-generating output from your total payroll investment. The utilization formula in BPO is a versatile strategic tool for measuring efficiency across every segment of your operation, not just the call center floor.
Ready to see how AI can genuinely boost your team's utilization and unlock new levels of efficiency? Discover how DialNexa provides human-like Voice AI that handles routine calls automatically. This frees up your agents for the complex, high-value work that really matters and helps turn more conversations into conversions. Explore our solutions at https://dialnexa.com.
Leave a Reply