> ## Documentation Index
> Fetch the complete documentation index at: https://dialnexa.com/docs/llms.txt
> Use this file to discover all available pages before exploring further.
# Workflow Lead History And Debugging In DialNexa
> Debug DialNexa workflow lead history with visited nodes, traversed edges, current node, call ids, transition reasons, metadata, and call log links.
Workflow lead history in DialNexa shows the actual path one lead followed through a workflow. It includes the lead, current execution state, all nodes, all edges, visited nodes, traversed edges, transition reasons, metadata, and call ids for voice call nodes.
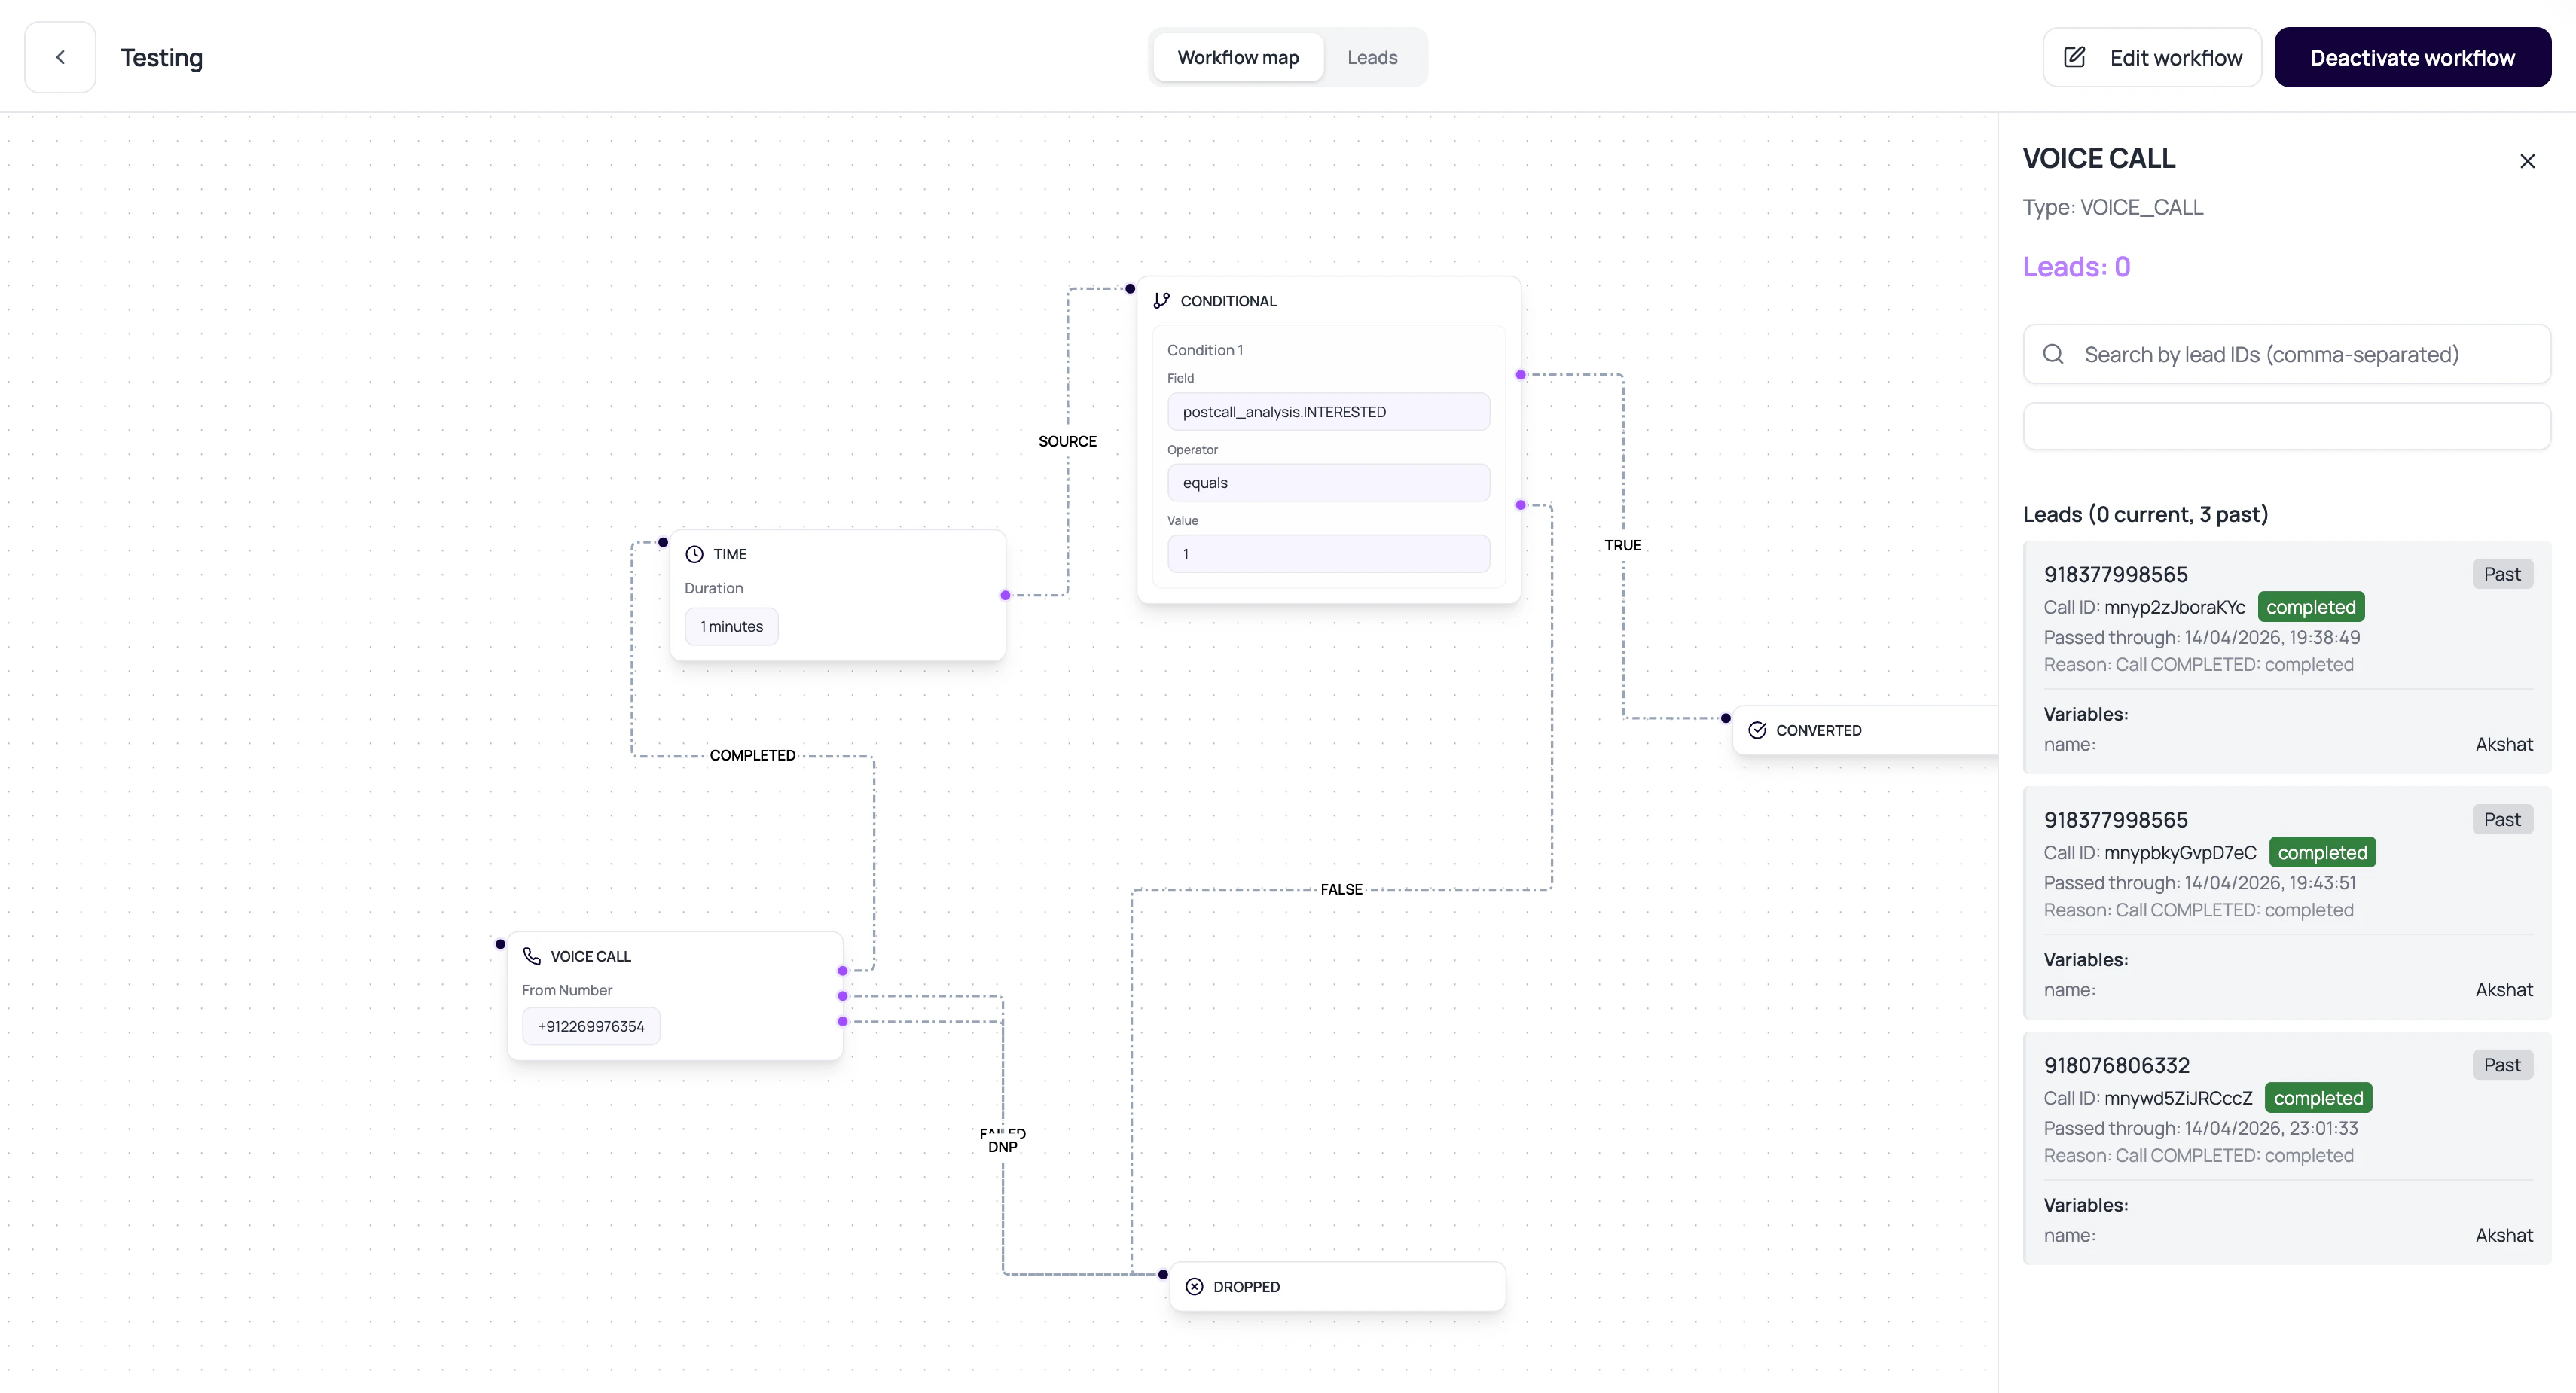 The workflow canvas tells you what should happen. Lead history tells you what did happen. The second one wins arguments.
## Lead History Evidence
The history response is built for debugging one lead.
| Evidence | Why it matters |
| ----------------- | ----------------------------------------------------------------------------- |
| lead | Phone number, dynamic variables, notes, and lead id. |
| execution | Current node id and execution status. |
| history | Ordered transitions with from node, to node, reason, timestamp, and metadata. |
| all\_nodes | Full workflow graph, including nodes the lead did not visit. |
| all\_edges | Full workflow structure with labels. |
| call\_id metadata | Links a Voice Call node transition to the exact call log. |
## How The History Graph Helps
The history view highlights actual execution.
Shows which nodes the lead entered.
Shows which edge labels were followed.
Shows where an active lead is waiting or processing.
Links voice call transitions to call logs.
## Debug A Stuck Lead
Start with the lead, not the whole workflow.
Check whether the lead is at a call, wait, condition, application, converted, or dropped node.
Look at reason and metadata for the latest move.
If the last node was a Voice Call node, inspect the exact call.
Adjust outputs, variables, or integration setup, then retest with a small sample.
## Related Reading
Inspect linked calls.
Debug action failures.
Understand status labels.
The workflow canvas tells you what should happen. Lead history tells you what did happen. The second one wins arguments.
## Lead History Evidence
The history response is built for debugging one lead.
| Evidence | Why it matters |
| ----------------- | ----------------------------------------------------------------------------- |
| lead | Phone number, dynamic variables, notes, and lead id. |
| execution | Current node id and execution status. |
| history | Ordered transitions with from node, to node, reason, timestamp, and metadata. |
| all\_nodes | Full workflow graph, including nodes the lead did not visit. |
| all\_edges | Full workflow structure with labels. |
| call\_id metadata | Links a Voice Call node transition to the exact call log. |
## How The History Graph Helps
The history view highlights actual execution.
Shows which nodes the lead entered.
Shows which edge labels were followed.
Shows where an active lead is waiting or processing.
Links voice call transitions to call logs.
## Debug A Stuck Lead
Start with the lead, not the whole workflow.
Check whether the lead is at a call, wait, condition, application, converted, or dropped node.
Look at reason and metadata for the latest move.
If the last node was a Voice Call node, inspect the exact call.
Adjust outputs, variables, or integration setup, then retest with a small sample.
## Related Reading
Inspect linked calls.
Debug action failures.
Understand status labels.