> ## Documentation Index
> Fetch the complete documentation index at: https://dialnexa.com/docs/llms.txt
> Use this file to discover all available pages before exploring further.
# DialNexa Monitoring Overview
> Understand DialNexa monitoring through Call History, call details, transcripts, recordings, post-call analysis, retries, transfers, audio cache, annotations, and exports.
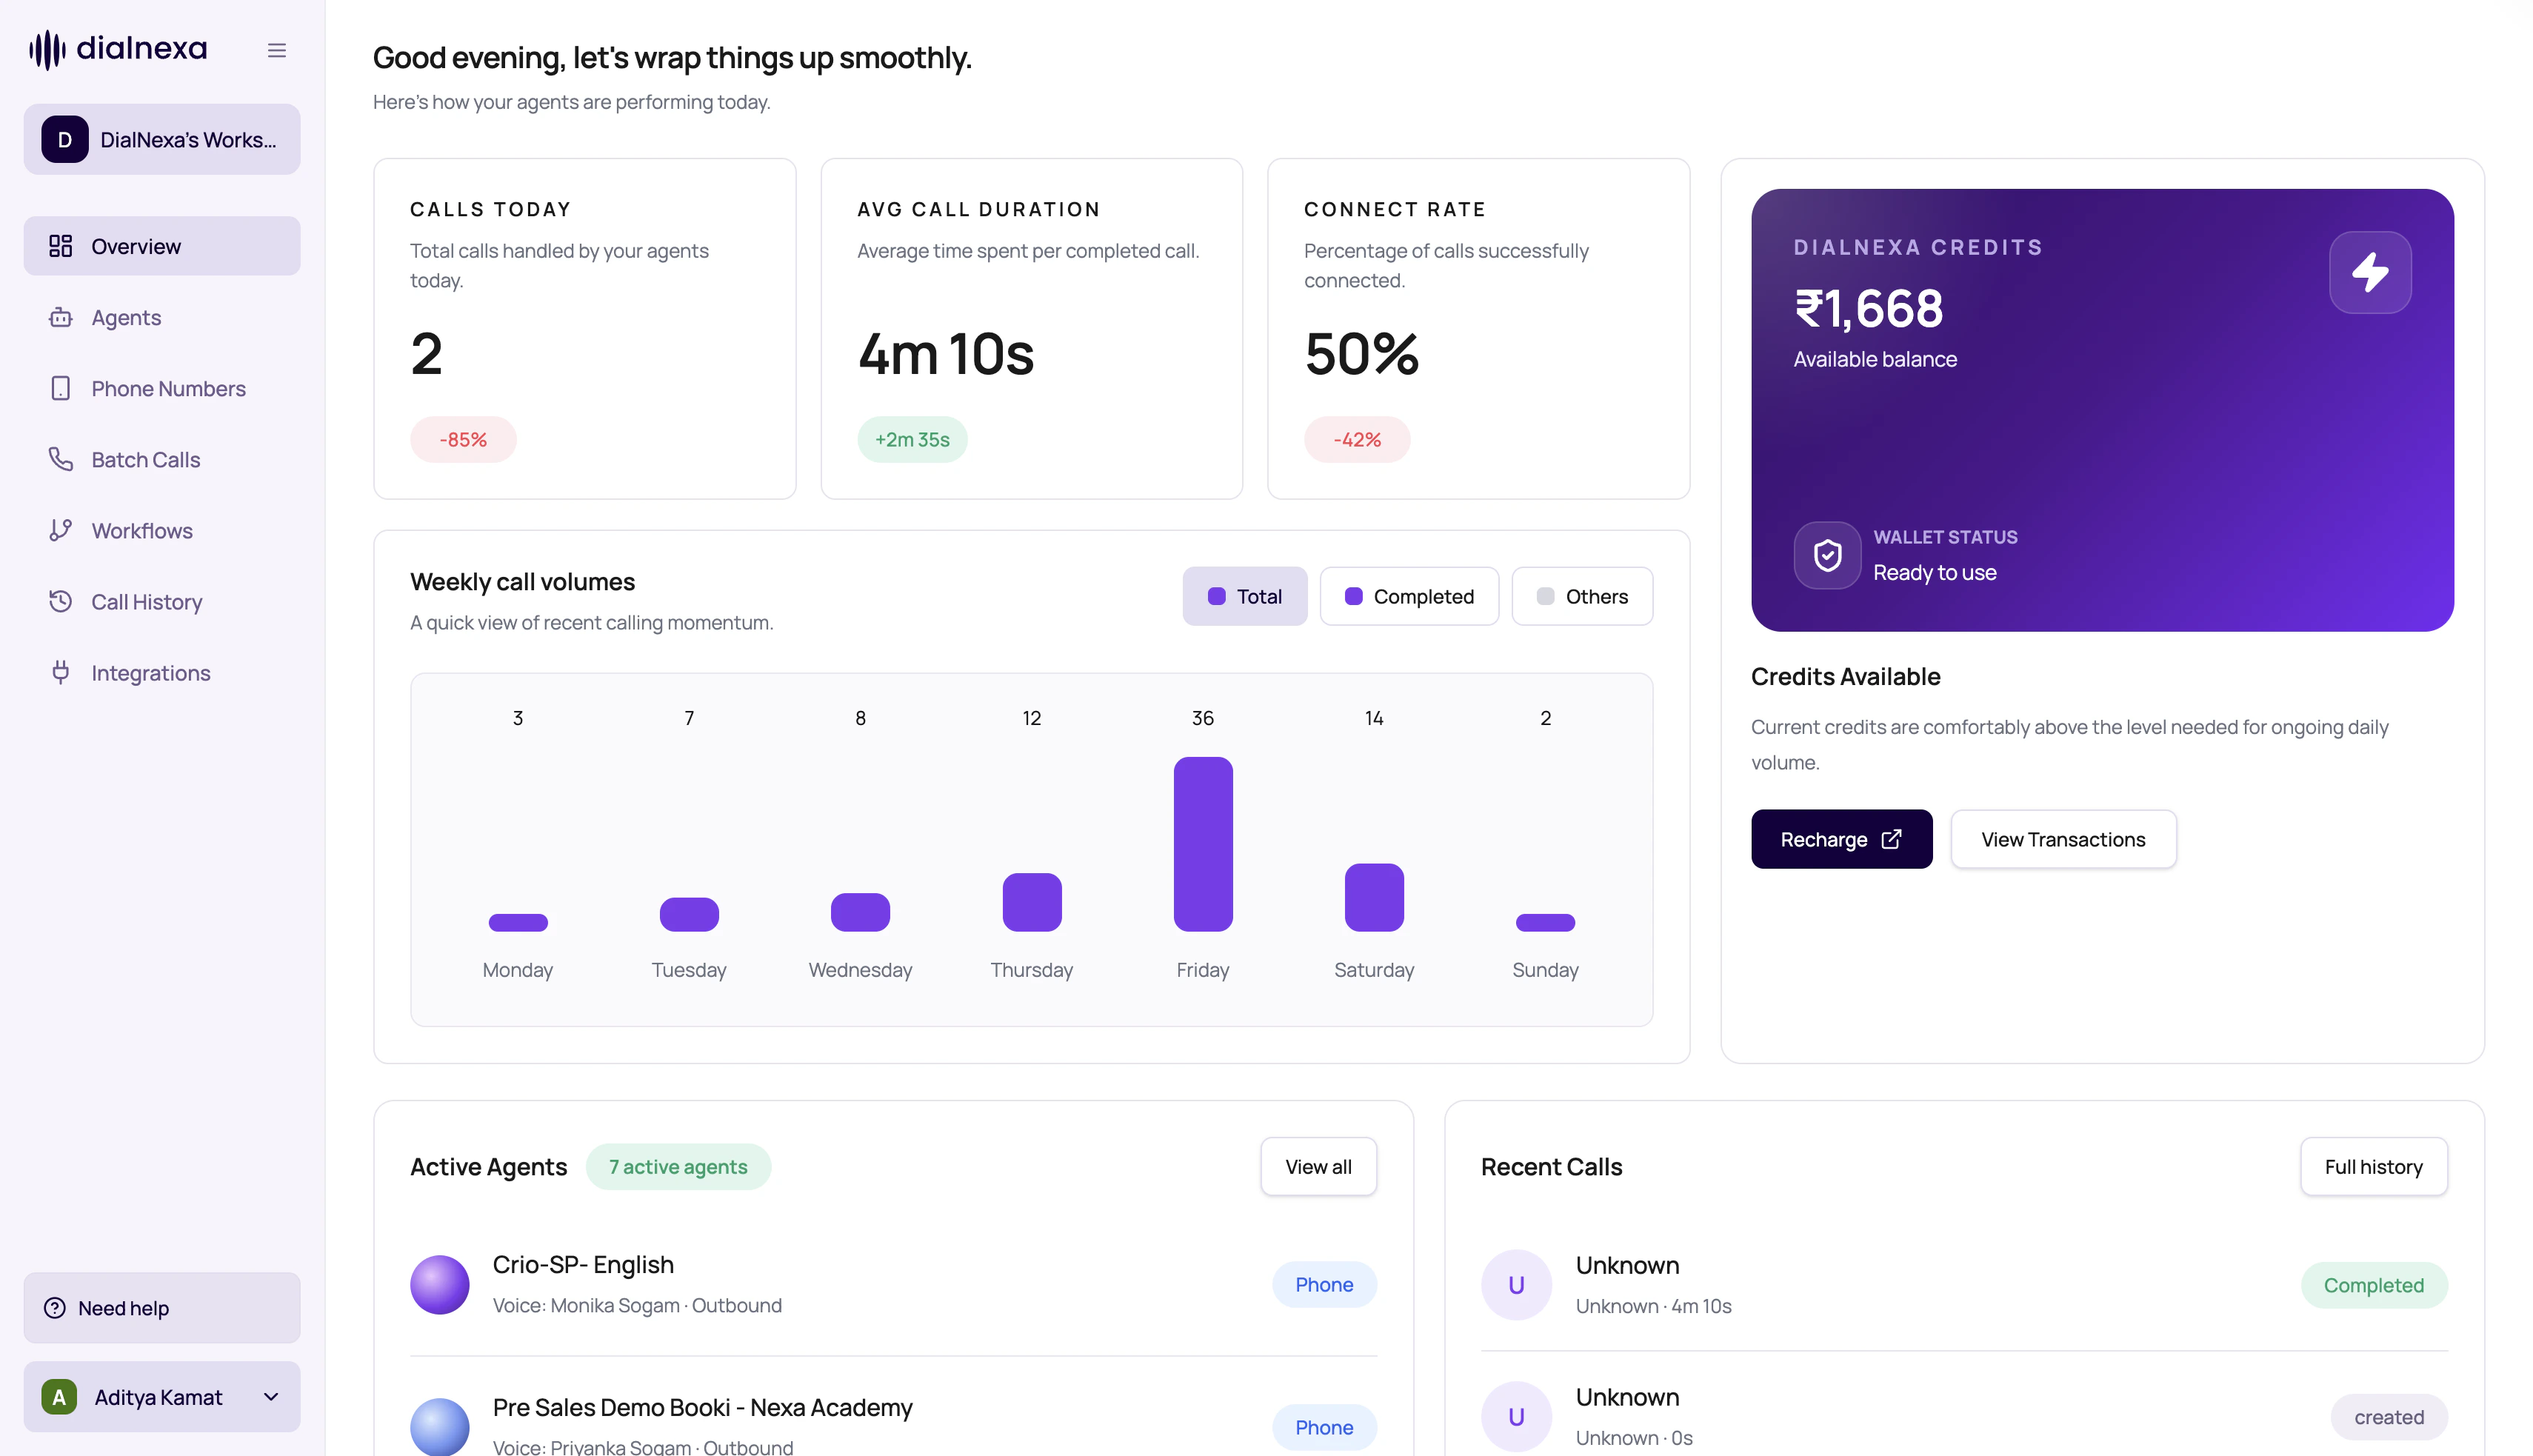
DialNexa monitoring is the evidence layer for every call. Call History and call detail pages show status, transcript, recording, summary, sentiment, duration, cost signals, extracted fields, retries, transfers, audio cache data, annotations, and exports.
 If setup pages are the plan, monitoring is the receipt. Keep the receipt.
## Monitoring Surfaces
Use the surface that matches the question.
| Question | Use |
| ------------------------------- | --------------------------------------------------------------------- |
| Which calls happened? | Call History table with filters, date range, sorting, and pagination. |
| What happened in one call? | Call detail page with recording, transcript, summary, and metadata. |
| What did the AI extract? | Post-call analysis results and custom fields. |
| Did retries or transfer happen? | Retry history and transfer detail tabs. |
| Can we report this externally? | CSV exports and webhook delivery evidence. |
## Evidence Types
Every evidence type answers a different question.
Did the call complete, fail, not pick, cancel, or expire?
What did the caller and agent sound like?
What text did the system capture?
What structured outcome was extracted?
## A Good Debugging Order
Use call id, batch id, date range, agent, status, or campaign filter.
Read status, duration, summary, transcript, recording, and extracted fields.
Open retries, transfers, or audio cache when relevant.
Open the agent version, phone number, batch, workflow, or integration that started the call.
## Related Reading
Find calls.
Inspect one call.
Report outcomes.
If setup pages are the plan, monitoring is the receipt. Keep the receipt.
## Monitoring Surfaces
Use the surface that matches the question.
| Question | Use |
| ------------------------------- | --------------------------------------------------------------------- |
| Which calls happened? | Call History table with filters, date range, sorting, and pagination. |
| What happened in one call? | Call detail page with recording, transcript, summary, and metadata. |
| What did the AI extract? | Post-call analysis results and custom fields. |
| Did retries or transfer happen? | Retry history and transfer detail tabs. |
| Can we report this externally? | CSV exports and webhook delivery evidence. |
## Evidence Types
Every evidence type answers a different question.
Did the call complete, fail, not pick, cancel, or expire?
What did the caller and agent sound like?
What text did the system capture?
What structured outcome was extracted?
## A Good Debugging Order
Use call id, batch id, date range, agent, status, or campaign filter.
Read status, duration, summary, transcript, recording, and extracted fields.
Open retries, transfers, or audio cache when relevant.
Open the agent version, phone number, batch, workflow, or integration that started the call.
## Related Reading
Find calls.
Inspect one call.
Report outcomes.